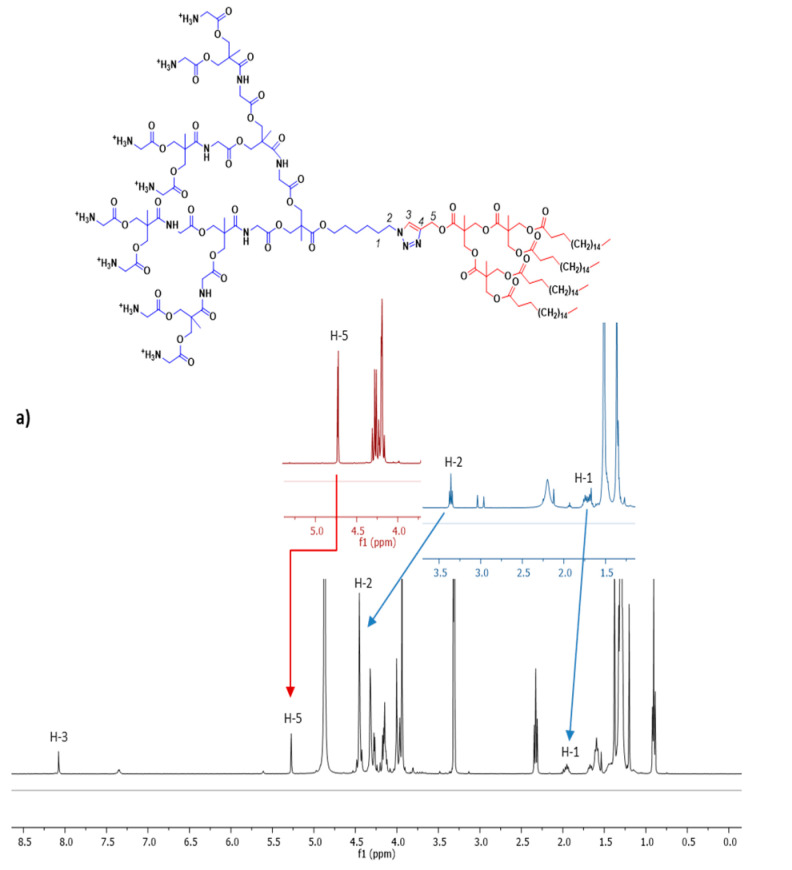
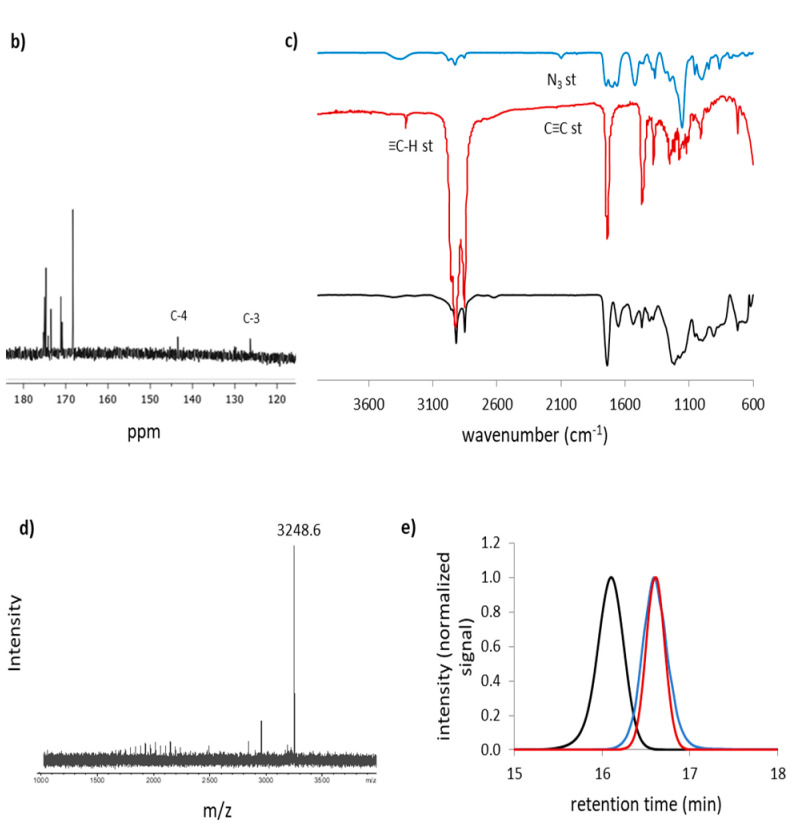
Figure 2.
(a) 1H NMR spectrum of (NH3+)8[GMPA]-[MPA](C17)4 dendrimer from 8.5 to 0.0 ppm in CD3OD recorded at 400 MHz. Main chemical shifts of key signals with respect to those in the starting dendrons are also indicated (colored fragments of each spectrum recorded in CDCl3 at 400 MHz). (b) 13C NMR spectrum from 180 to 120 ppm of (NH3+)8[GMPA]-[MPA](C17)4 in CD3OD recorded at 100 MHz (full spectrum in Supplementary Materials, Figure S3). (c) FTIR spectra in transmission mode, (d) Mass spectrum of the t-Boc-protected dendrimer and (e) SEC chromatograms of the t-Boc-protected dendrimer and its two precursor dendrons.


