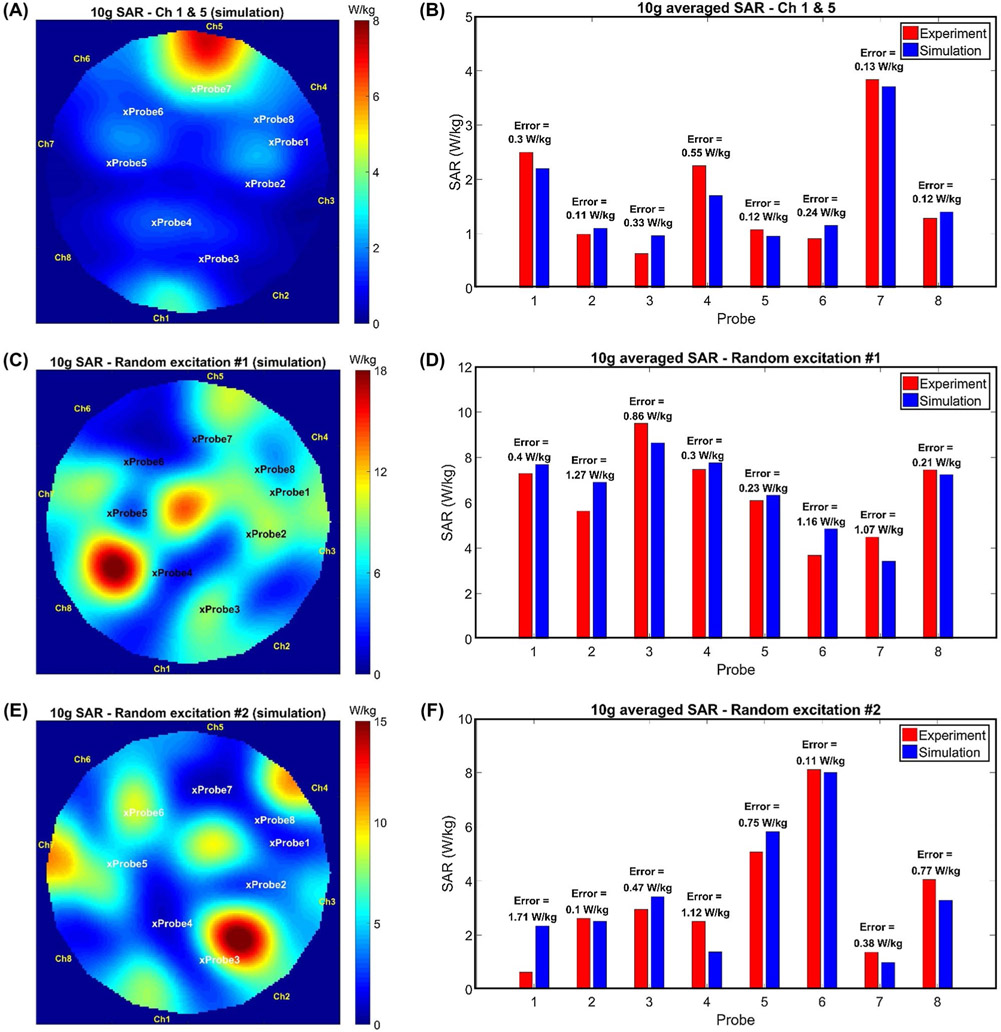
FIGURE 7.
Validation using temperature measurement. A, Simulated SAR-map while only channel 1 and 5 are excited. B, Comparison between simulated and experimentally estimated SAR at the tip of the temperature probes corresponding to channel 1 and 5 excitation. C,E, Simulated SAR-maps corresponding to 2 random excitations. D,F, Comparison between simulated and experimentally estimated SAR at the tip of the temperature probes corresponding to 2 random excitations. Cross signs on the SAR maps are indicating the positions of the temperature probes’ tips

