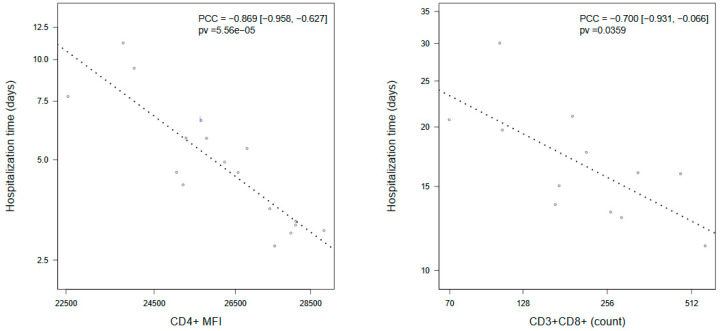
Figure 2.
Dotplots showing association of stay length in hospital with: CD4+MFI in COVID-19 patients that did not change non-critical clinical status (CD4 + MFI); and CD3+CD8+ T cell count in patients who reached critical condition during their hospitalization (CD3+CD8+ count). Association was assessed using a linear model controlling by age, gender, and time from symptoms onset. p-values were derived from a F-test of the linear model. Association was measured using Partial Correlation Coefficients (PCC) and their 95% confidence intervals. Dot lines represent the slope estimated by the linear model. Values are displayed after a-priori correction by the rest of covariates in the model.

