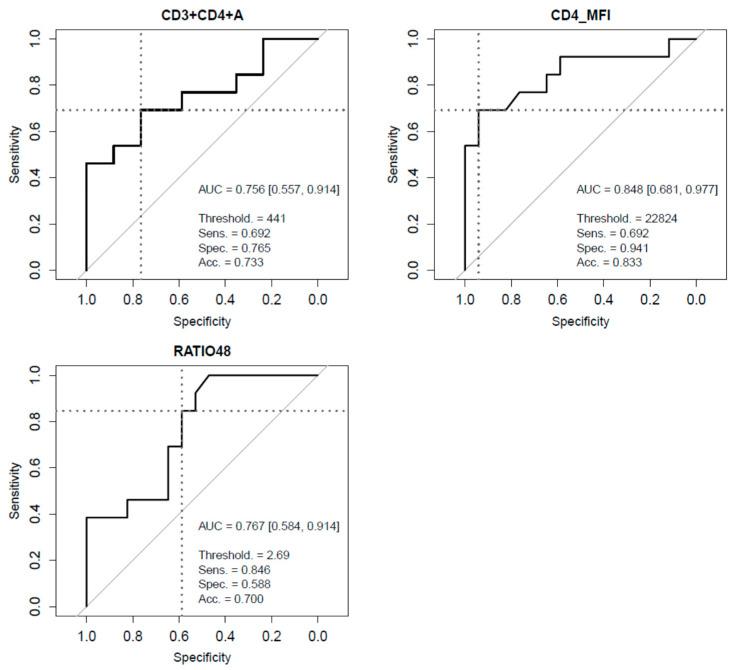
Figure 3.
Receiver Operating Characteristics (ROC) and their corresponding Area Under the Curve (AUC) assessing the ability of CD3+CD4+T cell count (CD3+CD4+A), CD4+MFI (CD4_MFI) and CD4+/CD8+ ratio (RATIO48) to predict COVID-19 critical clinical evolution. AUC intervals at 95% confidence were computed using bootstrap. Total accuracy, sensitivity, and specificity are displayed for the optimal threshold, defined as the ROC point closest to the top-left part of the plot (perfect sensitivity and specificity).

