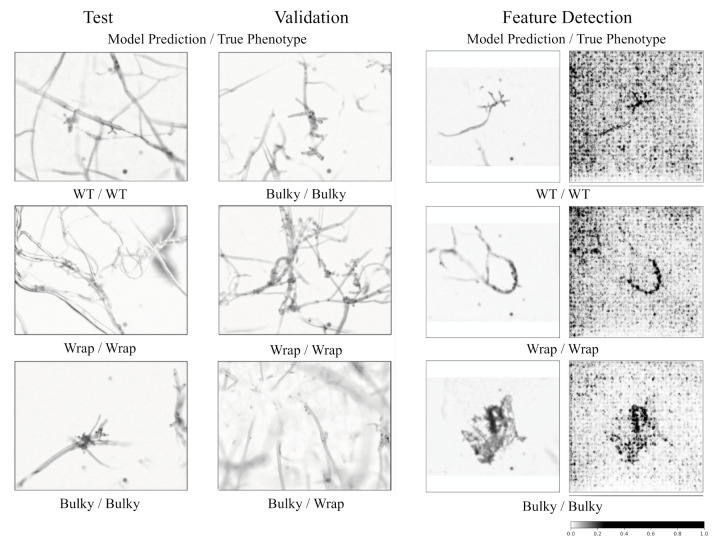
Figure 5.
Automatic classification of phenotypes. Model performance on test and validation sets is depicted in the first two columns. The far-left column shows a selected test set, followed by an example validation set in the second column. The third and fourth columns show feature importance evaluation for a few test samples. The third column shows the original image (after padding and resize) with the last column identifying feature importance. A higher value (black) in the last column indicates greater feature importance. All images are labeled with the model predicted phenotype first and manually identified phenotype second.

