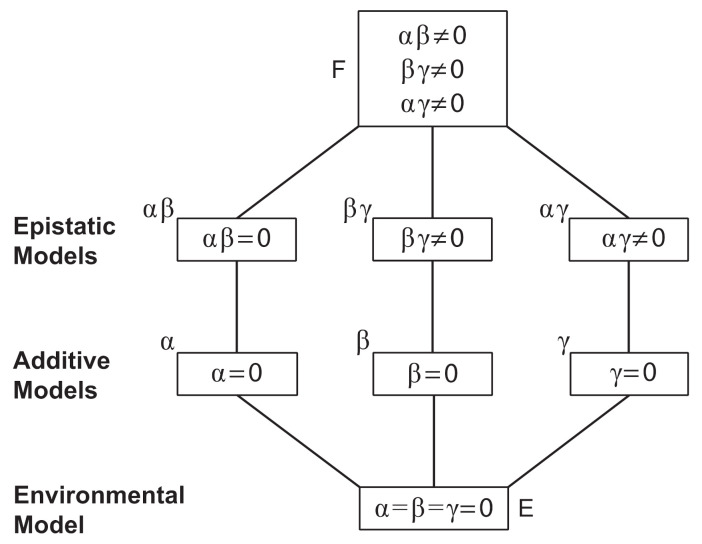
Figure 6.
The above hierarchy of models contained particular models that fit the phenotypic counts on three crosses between parents with different conidiophore phenotypes. At the top of the model hierarchy is the full epistatic model (F) with a grand mean, three additive allelic effects, and three epistatic interactions. At the bottom of the hierarchy is an environmental model with no genetic effects on conidiophore phenotype (E). Intervening models in the hierarchy drop one or more parameters describing the additive and epistatic effects of genes A, B, and C associated with the conidiophore phenotypes, A, B, and C.

