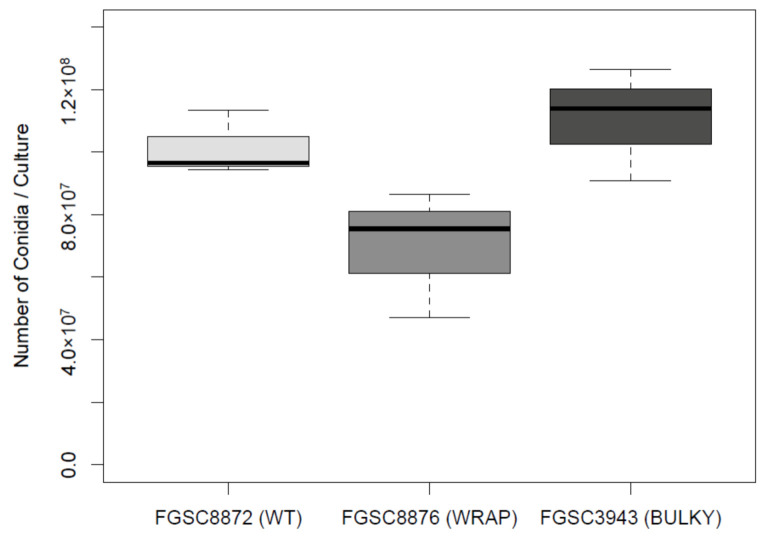
Figure 7.
Number of conidia suspended in water from an 82 mm diameter nitrocellulose membrane by each conidiophore phenotype. The dataset includes three biological replicates. The box shows the 25th and 75th percentiles, with the median denoted as a line inside. The whiskers represent the range of data. The t-test results for pairs are as follows: WT–Wrap, p = 0.09541; Wrap–Bulky, p = 0.06079; WT–Bulky, p = 0.505.

