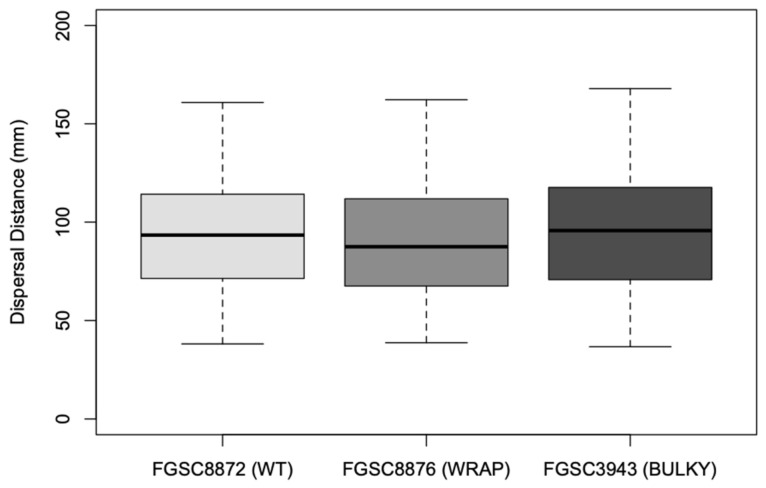
Figure 9.
Distance in mm to the center of each colony on sorbose + fructose + glucose (SFG) medium from the center of each nitrocellulose membrane. The dataset includes two biological replicates. The box shows the 25th and 75th percentiles, with the median denoted as a line inside. The whiskers represent the range of data. The t-test results for pairs are as follows: WT–Wrap, p = 0.0587; Wrap–Bulky, p = 3.101 × 10⁻⁵; WT–Bulky, p = 0.3466.

