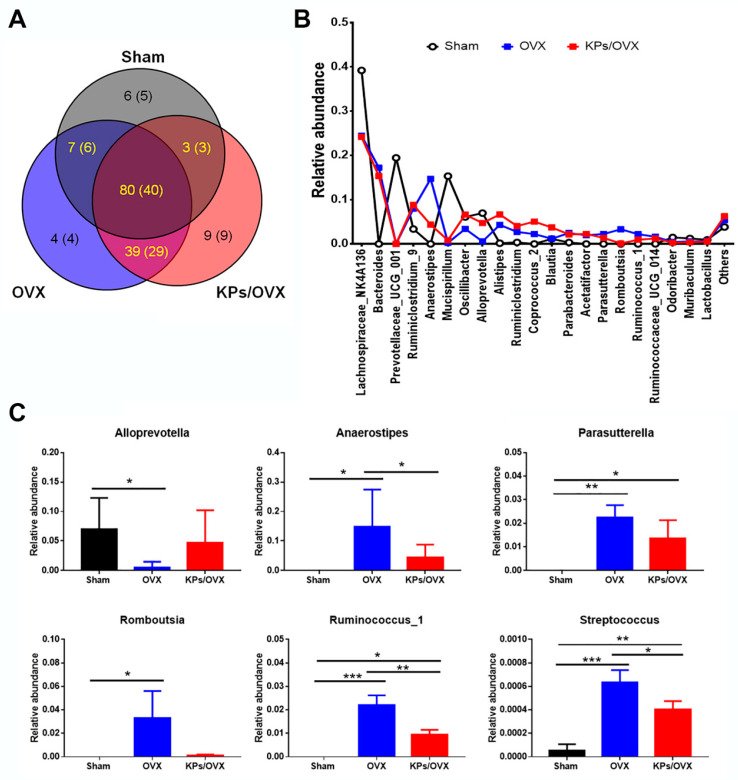
Figure 5.
Structural comparison of the gut microbiota at the genus level. (A) Venn diagram comparing the observed operational taxonomic units in the gut microbiota of sham, OVX and KPs/OVX mice. (B) Major bacterial genera identified in this study. (C) Mean relative abundances of the genera Alloprevotella, Anaerostipes, Parasutterella, Romboutsia, Ruminococcus_1 and Streptococcus. Compared with the sham group, these bacterial genera were inhibited or enriched in the OVX group but were reversed in the KPs/OVX group. The data are presented as means ± standard deviation (SD) (n = 3). Statistical analysis was performed by one-way ANOVA and Tukey’s post hoc test. Statistical significances are indicated by asterisks (*, p < 0.05; **, p < 0.01 and ***, p < 0.001).

