Figure 2.
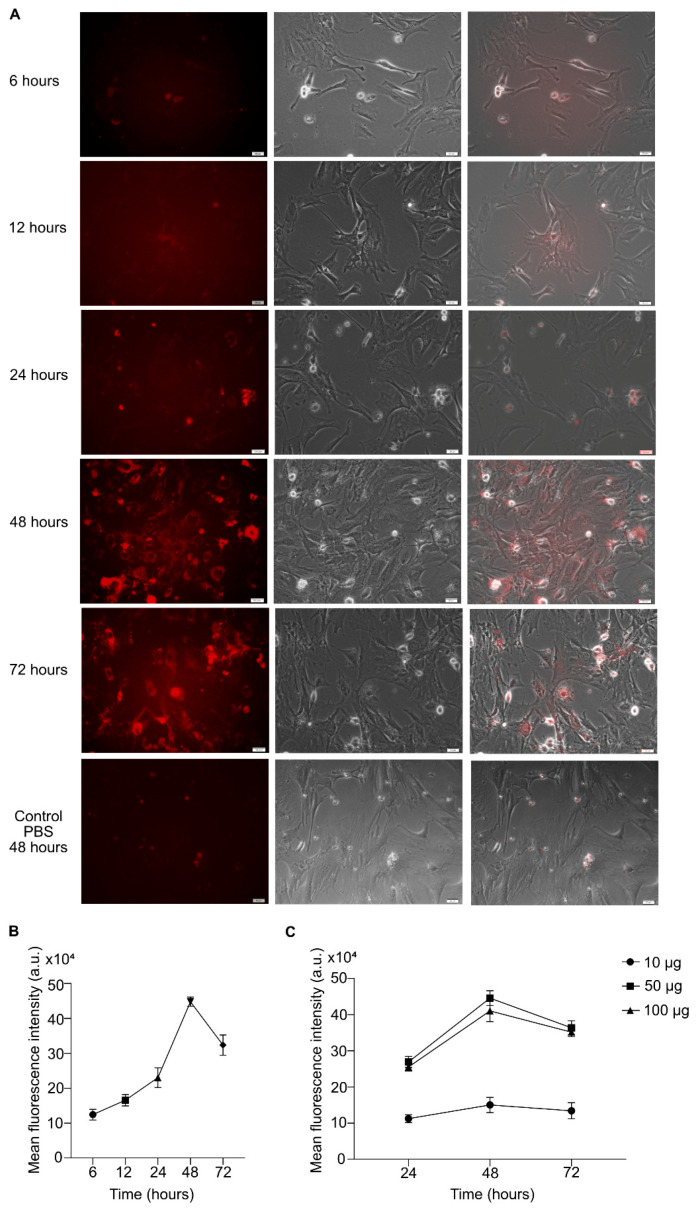
Internalization of the labeled mouse insulinoma (MIN6)-derived exosomes by the MEFs. (A) Fluorescence microscopy images depicting the time-dependent internalization of ExoGlow-labeled exosomes (red) by MEF cells. Scale bar = 20 µm. The first panel shows MEFs that have successfully internalized the labeled exosomes (red channel); the middle panel depicts the bright-field images of all the cells present in the respective microscopic field, and the last panel represents the merged images. (B) Quantification of the mean fluorescence intensity observed in (A). (C) Quantitation of the optimal exosome amount required for efficient internalization by MEFs. The data shown represent the mean ± SEM of three independent experiments. a.u. = arbitrary units.

