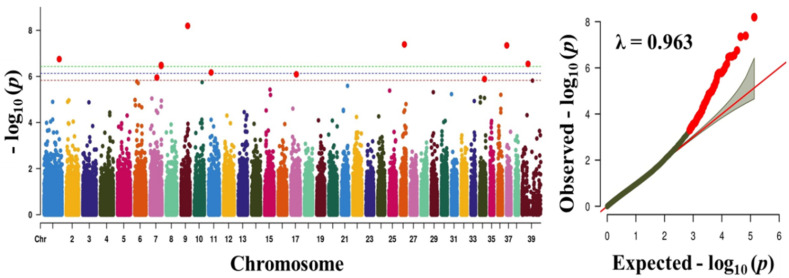
Figure 2.
Manhattan plot showing the distribution of p-values of single nucleotide polymorphism (SNP) markers associated with body weight. Greenline designates the genome-wide significant threshold level of p < 3.74 × 10⁻⁷, blue line designates suggestive threshold level of p < 7.48 × 10⁻⁷, and red line designates suggestive threshold level of p < 5.82 × 10⁻⁶. The quantile-quantile (Q-Q) plot of the GWAS is shown on the right side. GWAS - genome-wide association study.

