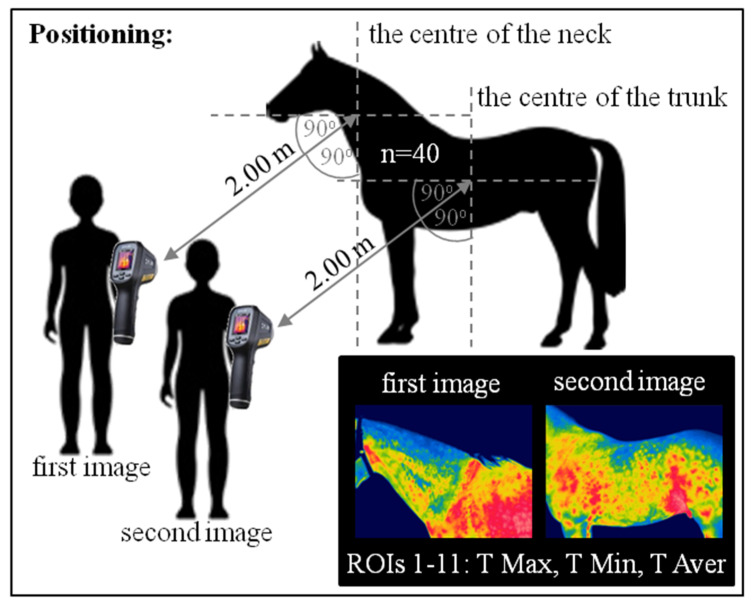
Figure 1.
The procedure of the thermographic data collection. The measurements were repeated three times: Before exercise, immediately after exercise, and 30 min after exercise. Two images were taken each time. In each image, 11 regions of interest (ROIs) were determined. The maximal temperature (T Max), the minimal temperature (T Min), and the average temperature (T Aver) were calculated for each of the ROIs.

