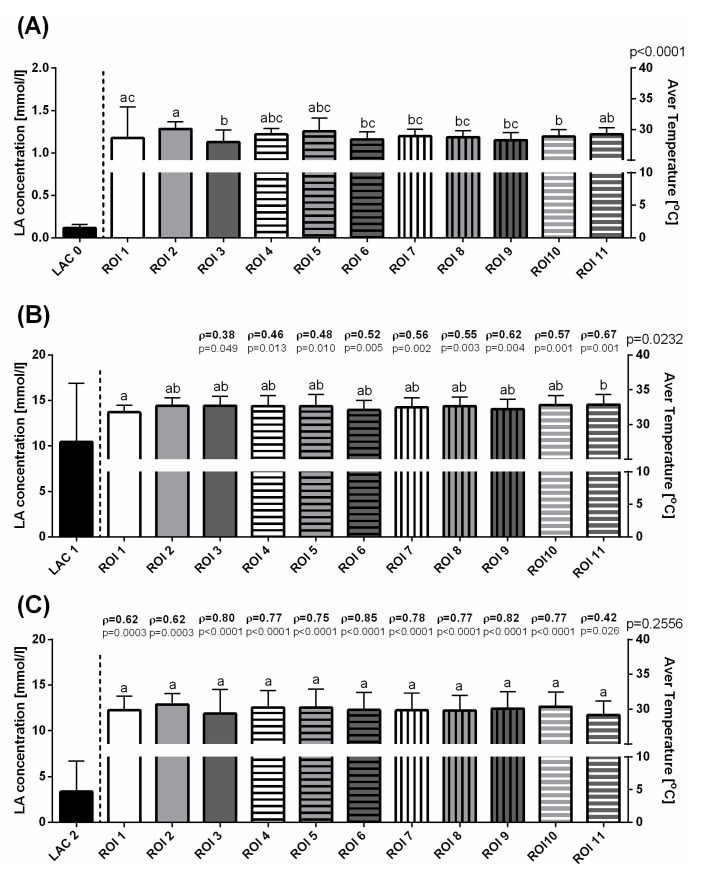
Figure 5.
The blood lactate concentration and average temperatures (mean + SD) in the selected ROIs before training (A), immediately after exercise (B), and 30 min after exercise (C). Lowercase letters indicate differences between regions of interest (ROIs) for p < 0.05. The p-value for ROI comparison is indicated above the right X-axis. The correlations between blood lactate concentration and average temperatures are indicated above consecutive temperature bars using the Spearman correlation coefficient (ρ), which reflected the consistency when p < 0.05.

