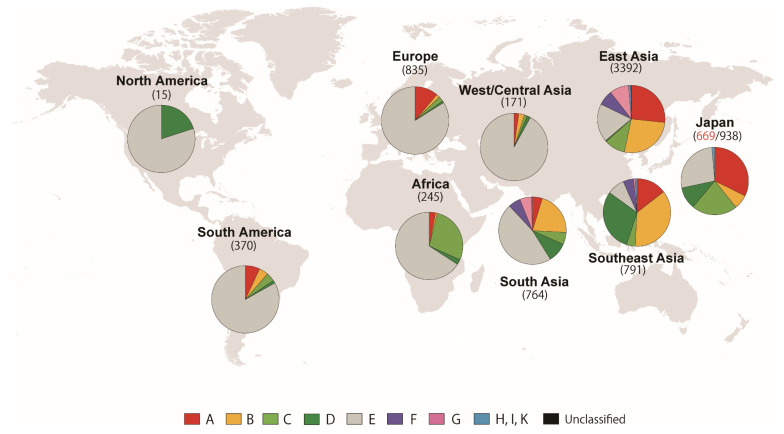
Figure 2.
Distribution of D-loop haplogroups worldwide inferred from 6795 D-loop sequences obtained from GenBank and 669 sequences of Japanese indigenous chickens obtained in this study. The frequencies of nine haplogroups (A, B, C, D, E, F, G, H/I/K, and unclassified) in nine regions of the world are shown by pie charts. The number of sequences in each region is indicated in parentheses.

