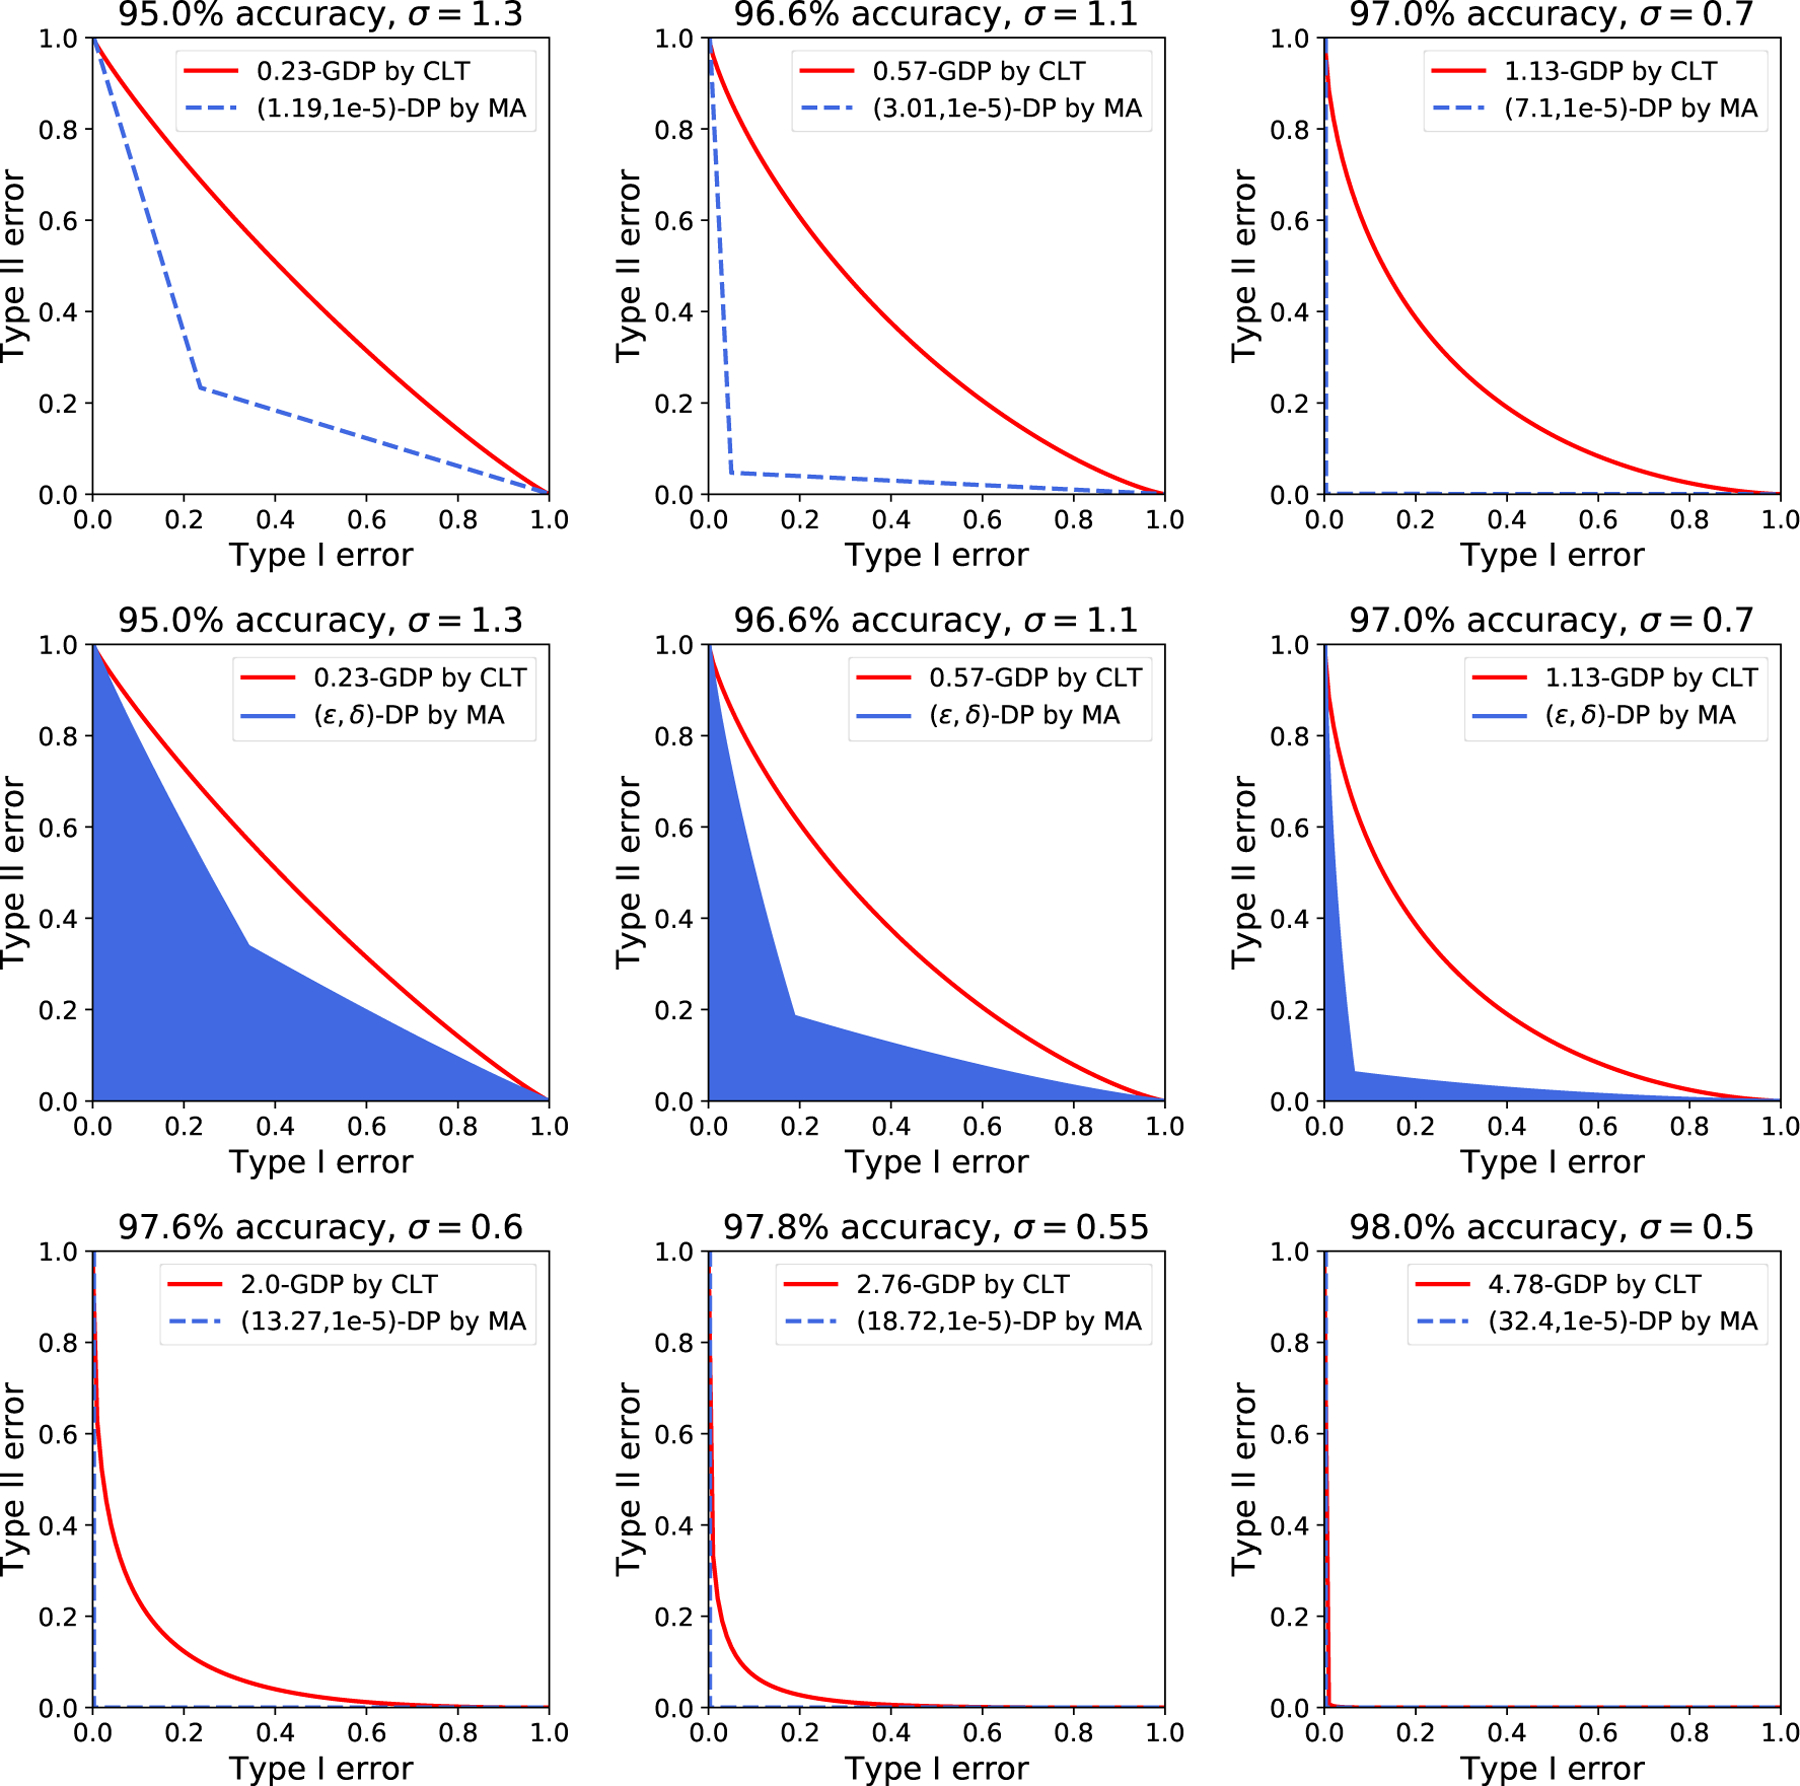
Figure 3:

Comparisons between the two ways of privacy analysis on MNIST in terms of the tradeoff between type I and type II errors, in the same setting as Table 1. The plots are different from Figure 7 in [18]. The (ε, δ)-DP guarantees are plotted according to (1). The blue regions in the plots from the second row correspond to all pairs of (ε, δ) computed by MA. The blue regions are not noticeable in the third row.
