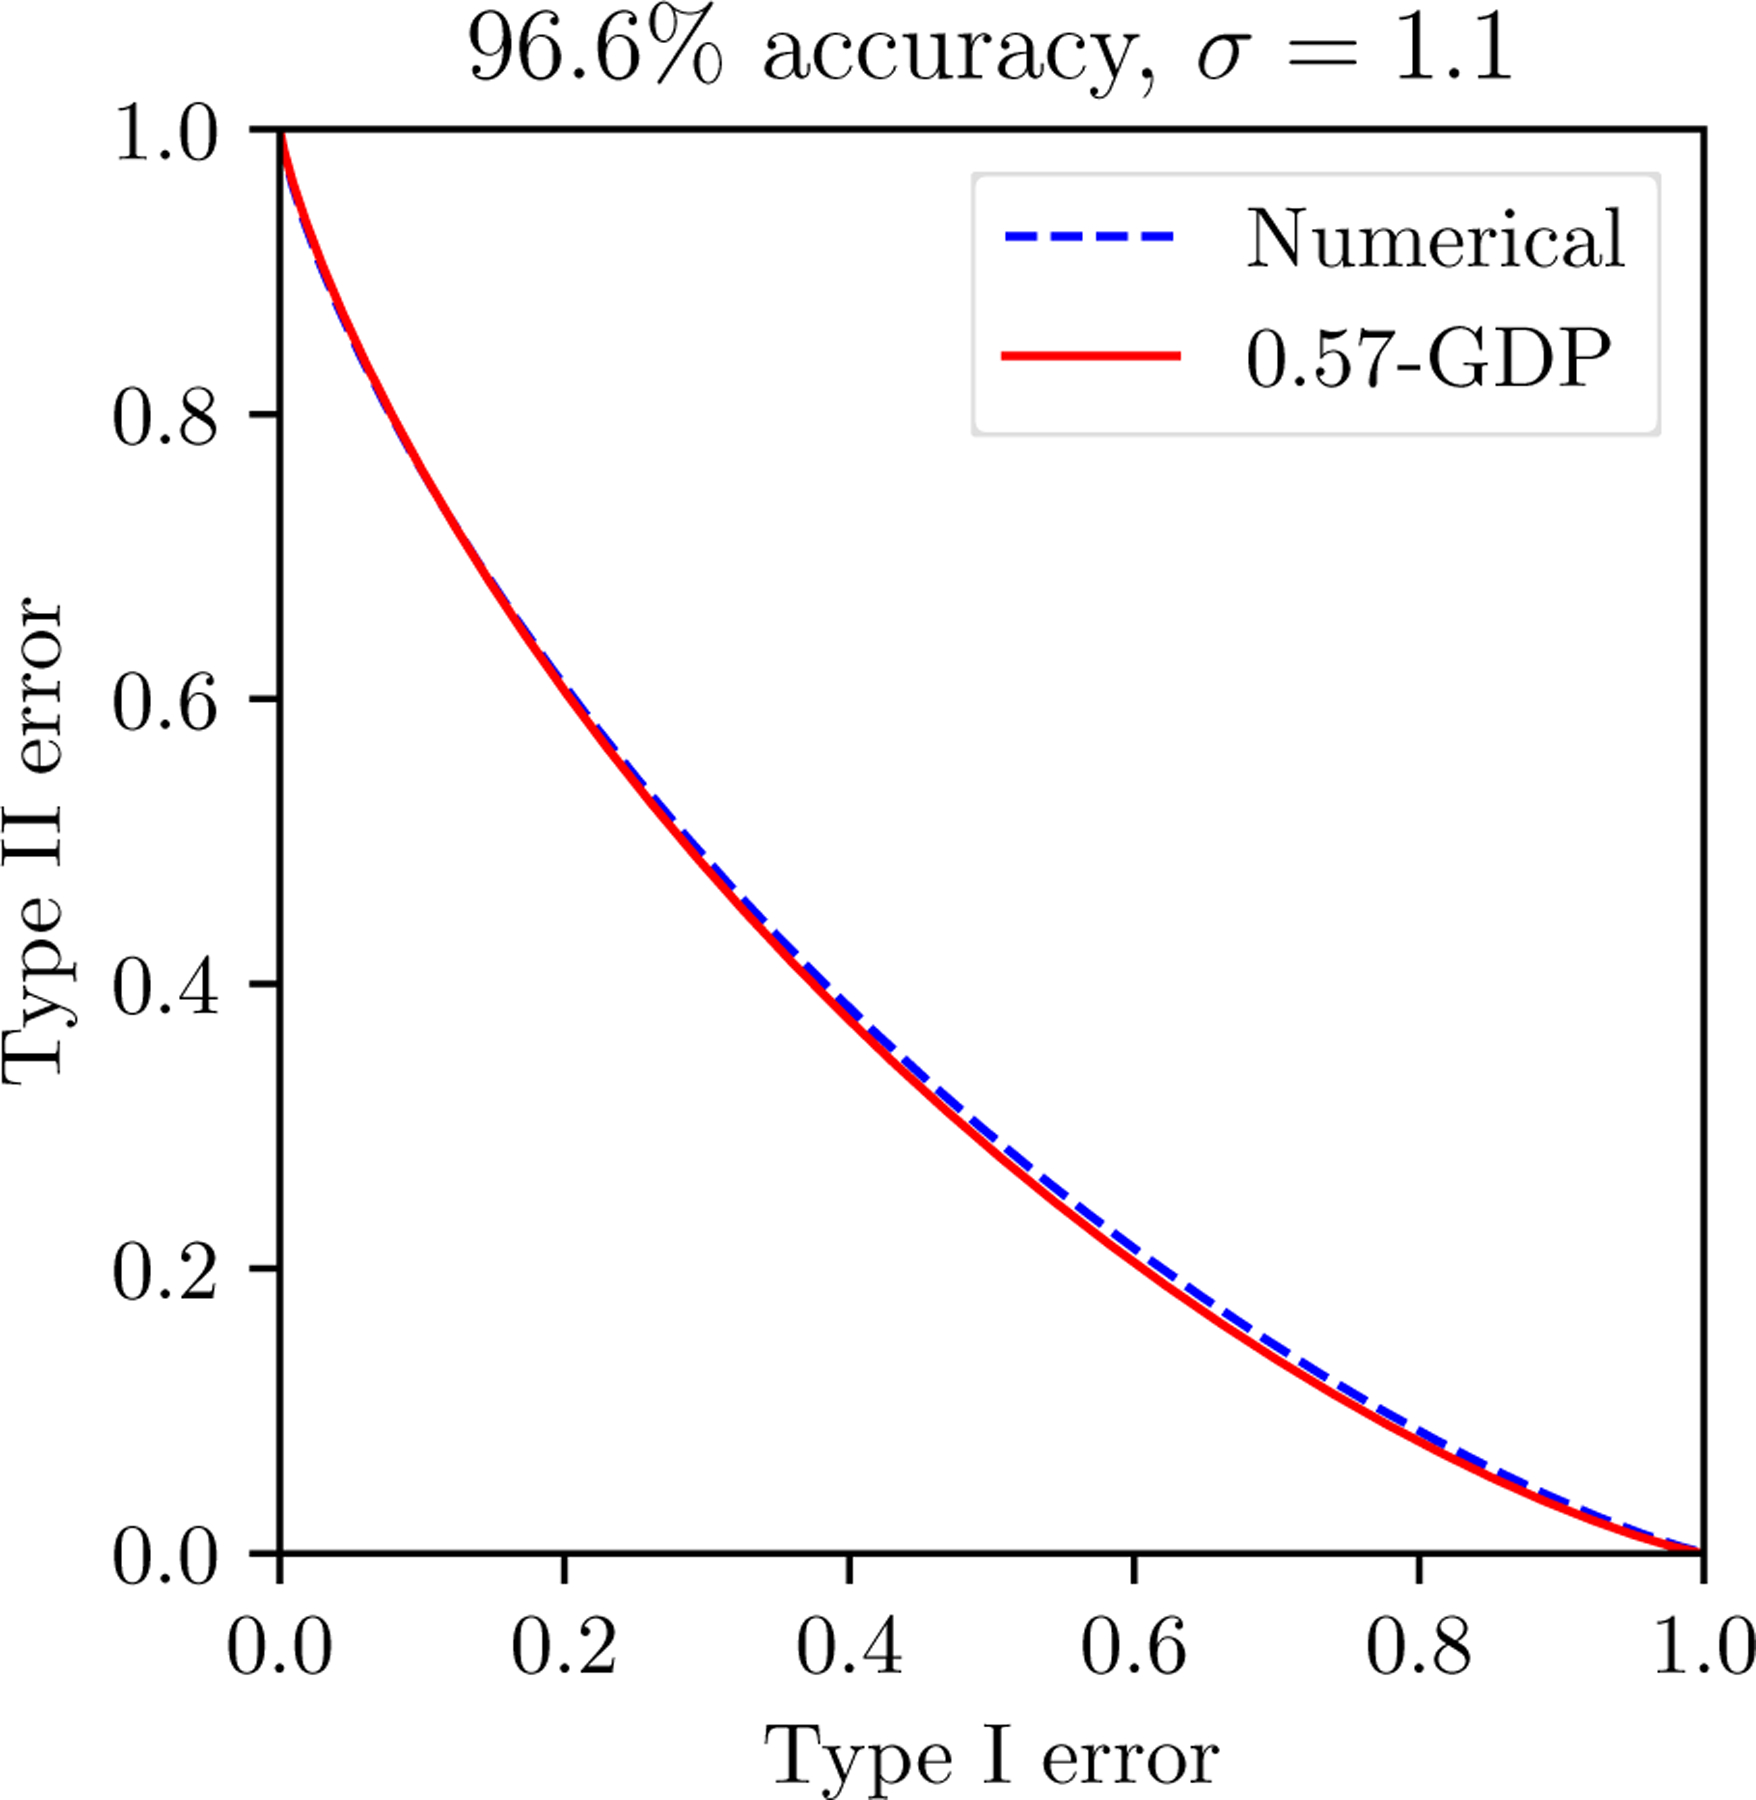
Figure 5:

(pG1/σ + (1 − p)Id)⊗T (blue dashed) is numerically computed and compared with the GDP limit (red solid) predicted by CLT. The two are almost identical at merely epoch one.

(pG1/σ + (1 − p)Id)⊗T (blue dashed) is numerically computed and compared with the GDP limit (red solid) predicted by CLT. The two are almost identical at merely epoch one.