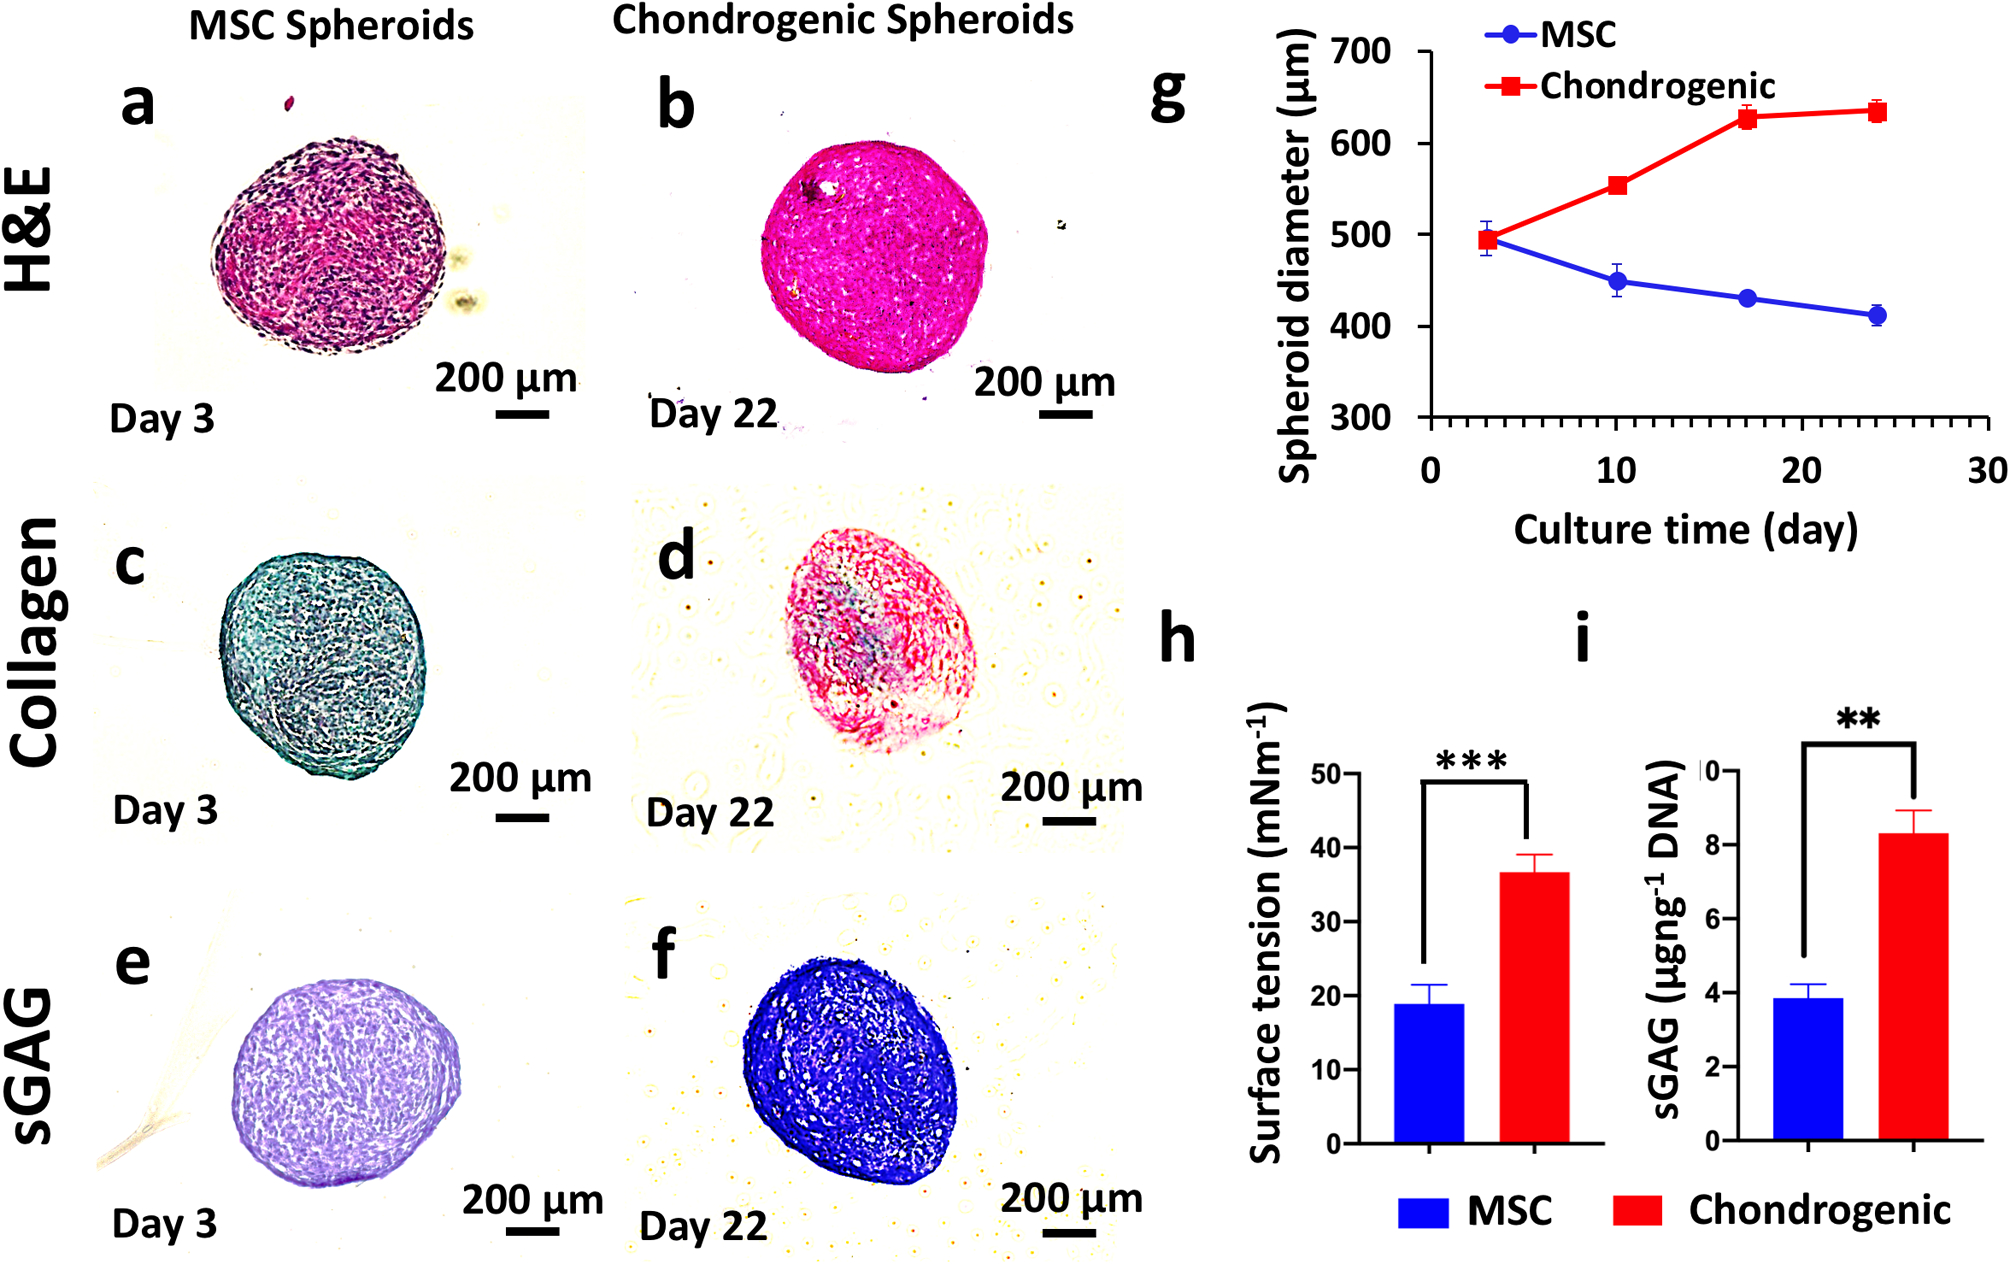
Fig. 4. Chondrogenic differentiation of mesenchymal stem cell spheroids.

Histological staining of mesenchymal stem cell (MSC) (at Day 3, prior to bioprinting for Strategy I) and chondrogenic spheroids (at Day 22, prior to bioprinting for Strategy II) a, b hematoxylin and eosin, c, d picrosirius red/fast green, and e, f toluidine blue staining. MSC spheroids were less dense and were negative (demonstrated by green color) for collagen and sGAG (demonstrated by purplish color), whereas the chondrogenic spheroids were denser and positive (demonstrated by green color) for collagen and sGAG (demonstrated by blue color). g Diameter change of MSC and chondrogenic spheroids over 24 days (n = 10). Note that chondrogenic spheroids were cultured in MSC growth media for the first 3 days of culture. The diameter of chondrogenic spheroids increased from 500 μm (on Day 3) to 600 μm (on Day 18) and retained their size for the remaining period of the culture until Day 24. The diameter of MSC spheroids gradually decreased from 500 μm (on Day 3) to 400 μm (on Day 24). h Surface tension, the surface tension values for both spheroids were within feasible ranges for bioprinting and i sGAG content measurements (normalized to DNA amount of MSC and chondrogenic spheroids at Day 24) (n = 3, **p < 0.01 and ***p < 0.001). A 2.2-fold increase in the sGAG content (μg ng−1 DNA) shown for chondrogenic spheroids as compared to MSC spheroids. Error bars were plotted as mean ± standard deviation.
