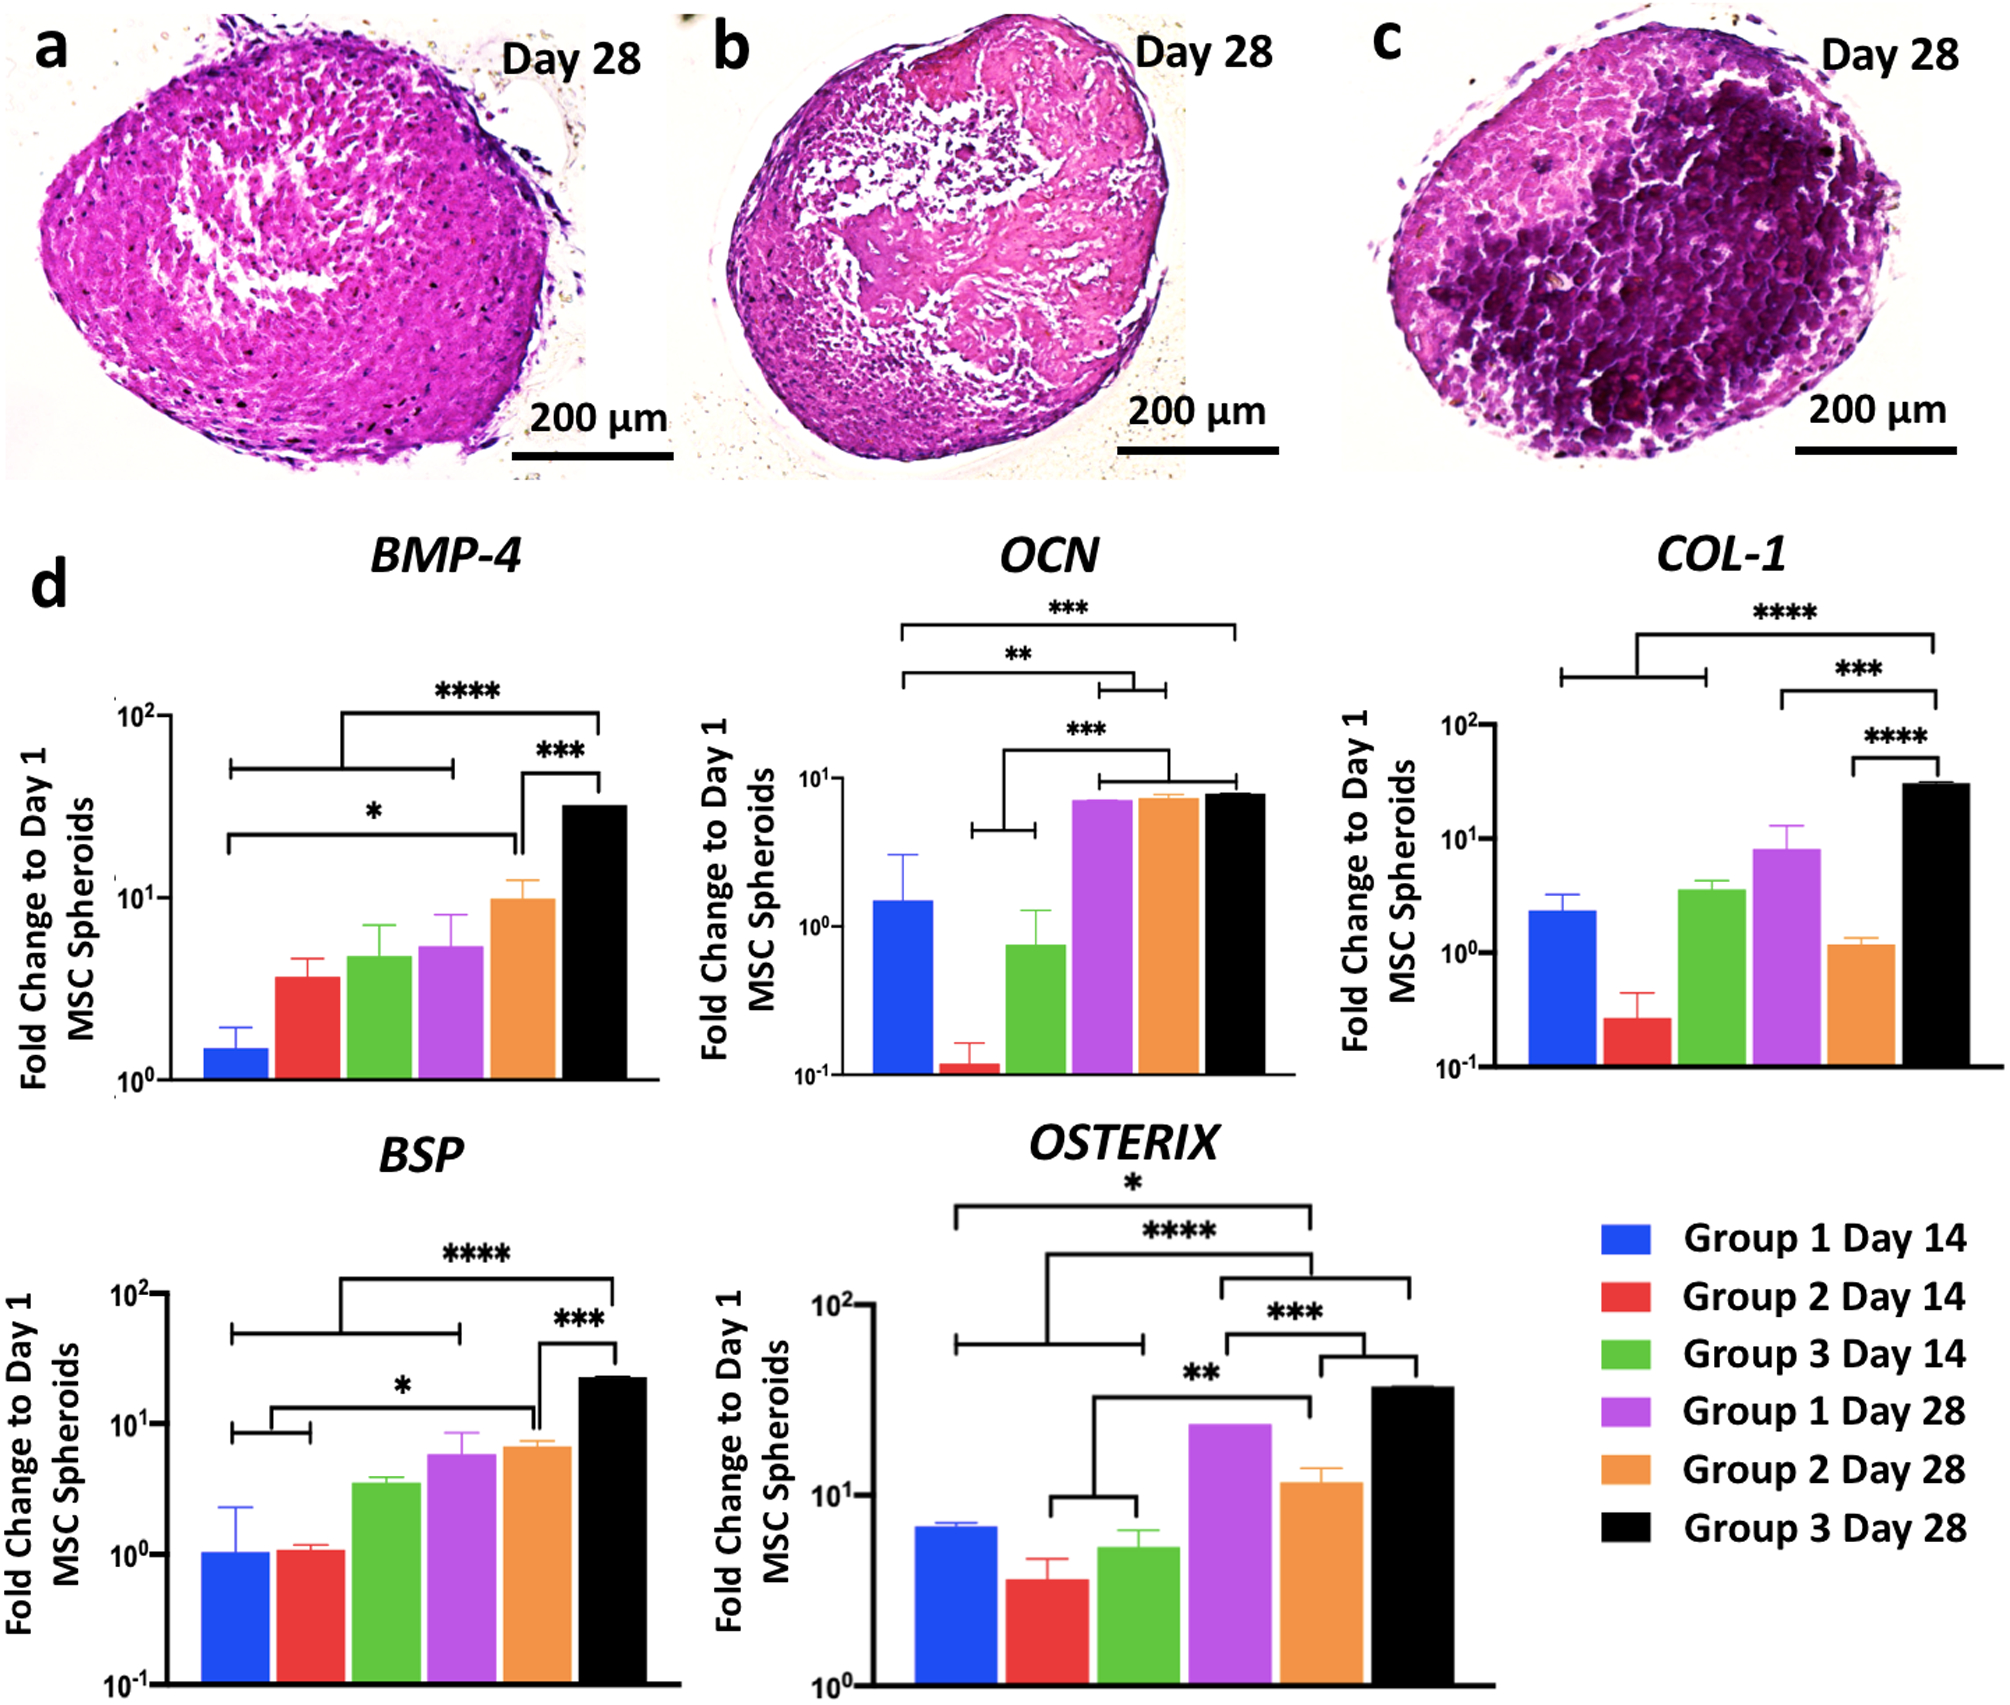
Fig. 6. Osteogenic differentiation of mesenchymal stem cell spheroids.

Hematoxylin and eosin staining images of spheroids of a Group 1, b Group 2, and c Group 3 at Day 28 demonstrating stronger bone matrix deposition in Group 3. d BMP-4, OCN, COL-1, BSP, and OSTERIX gene expressions of Group 1 Day 14, Group 2 Day 14, Group 3 Day 14, Group 1 Day 28, Group 2 Day 28, and Group 3 Day 28 (n = 3; *p < 0.05, **p < 0.01, ***p < 0.001, and ****p < 0.0001). All genes for all groups showed greater level of expression on Day 28 compared to Day 14. No significant difference was observed at Day 14 among groups; expression of BMP-4 (4.8- and 32.3-folds), COL-1 (3.6- and 30.5-folds), BSP (3.5- and 22.8-folds), and OSTERIX (5.3- and 37-folds) in Group 3 on Day 28 was significantly higher than those for Groups 1 and 2, respectively. Error bars have been plotted as mean ± standard deviation.
