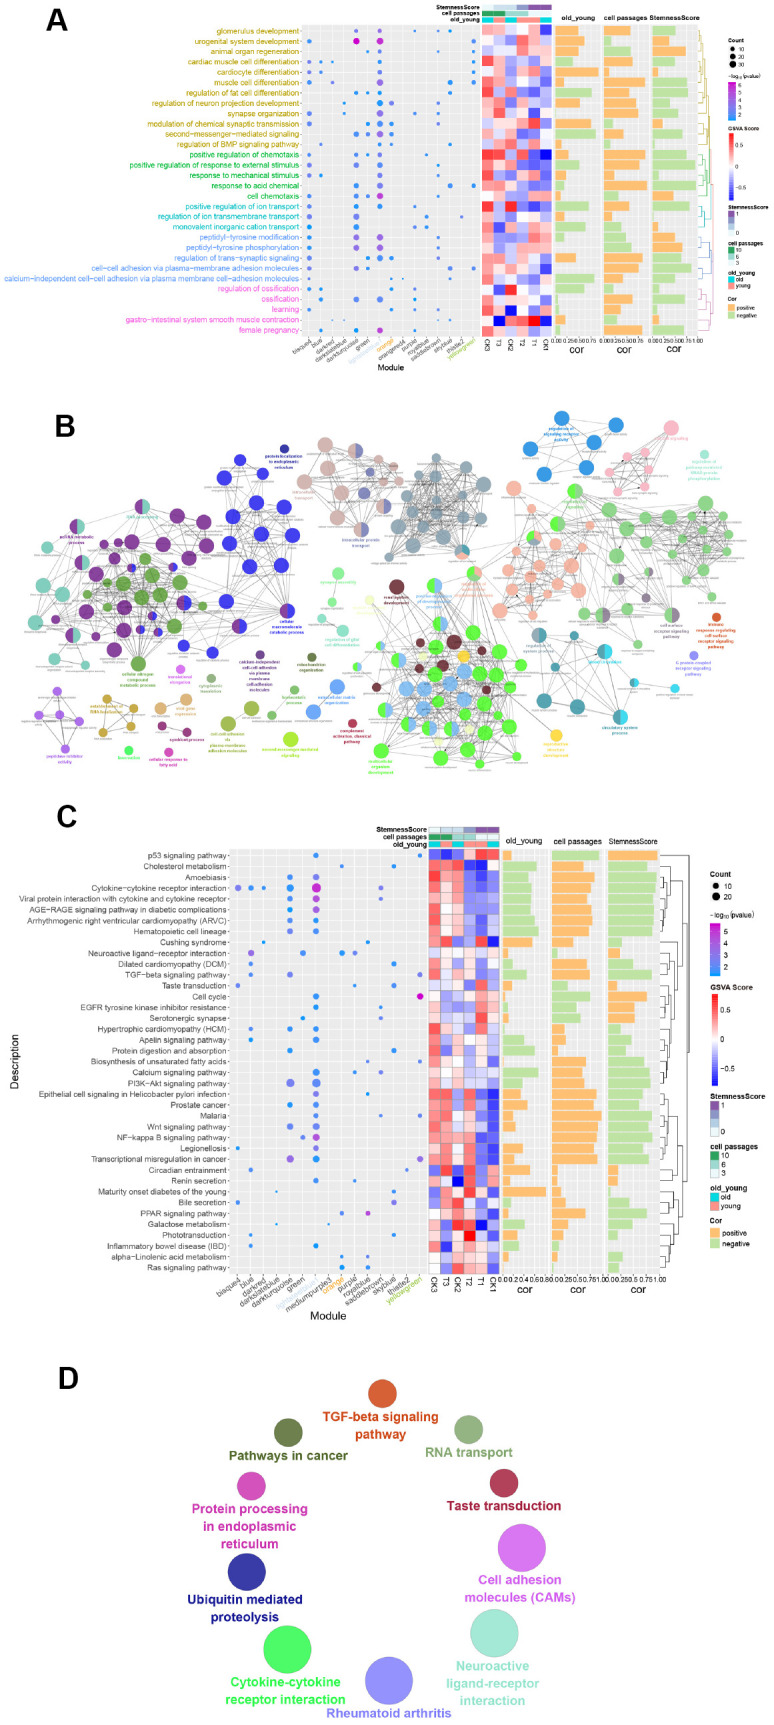
Figure 4.

Functional enrichment analysis of gene modules. (A) GO Enrichment Analysis. Enrichment increased significantly from blue to purple. The larger the circle, the more significant the percentage of module genes that GO functions into the gene. (B) Gene functional enrichment was conducted using Cytoscape. Each dot represents a BP, and a total of 244 are enriched. (C) Enrichment Analysis of the Module Gene KEGG Pathway. From blue to purple, the concentration increased significantly. The larger the circle, the more significant the proportion of modular genes present in the KEGG pathway entry genes. (D) Enriched to 10 KEGG pathways using the ClueGO plugin for Cytoscape.
