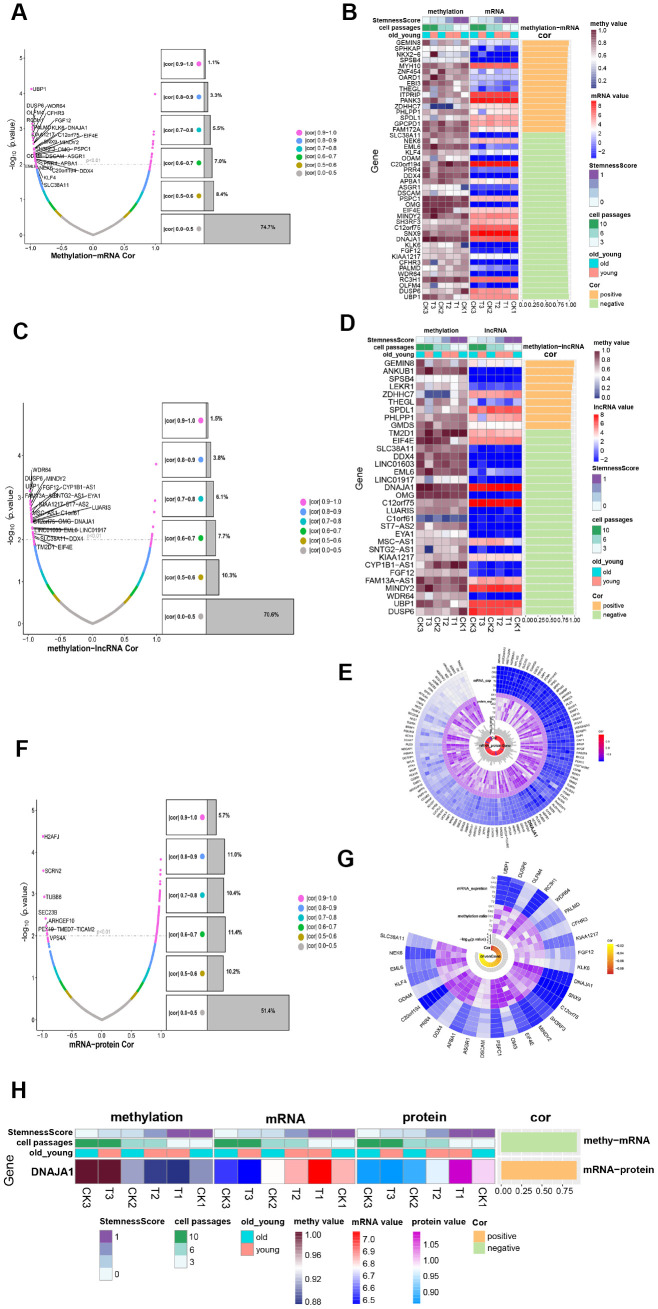
Figure 5.
Methylation regulates ADSCs’ expression. (A) Volcanic maps show the correlation and significance of methylation and mRNA expression. (B) Heatmap shows the expression of methylation-transcription related genes among different phenotypes. (C) Volcanic maps show correlation and significance of methylation and lncRNA expression. (D) Heatmap shows the expression of methylation-lncRNA related genes in different phenotypes. (E) CircPlot shows the methylation rate and mRNA expression of 29 methylation-regulated transcription genes in 6 samples as well as their correlation and significance. (F) Volcanic maps show the correlation and significance of mRNA and protein expression. (G) circPlot displays the mRNA and protein expression of 117 mRNA_protein related genes in 6 samples, and their correlation and significance, highlighting a methylation-regulated expression gene. (H) Heat Map-Correlation Histogram showing DNAJA1 expression.

