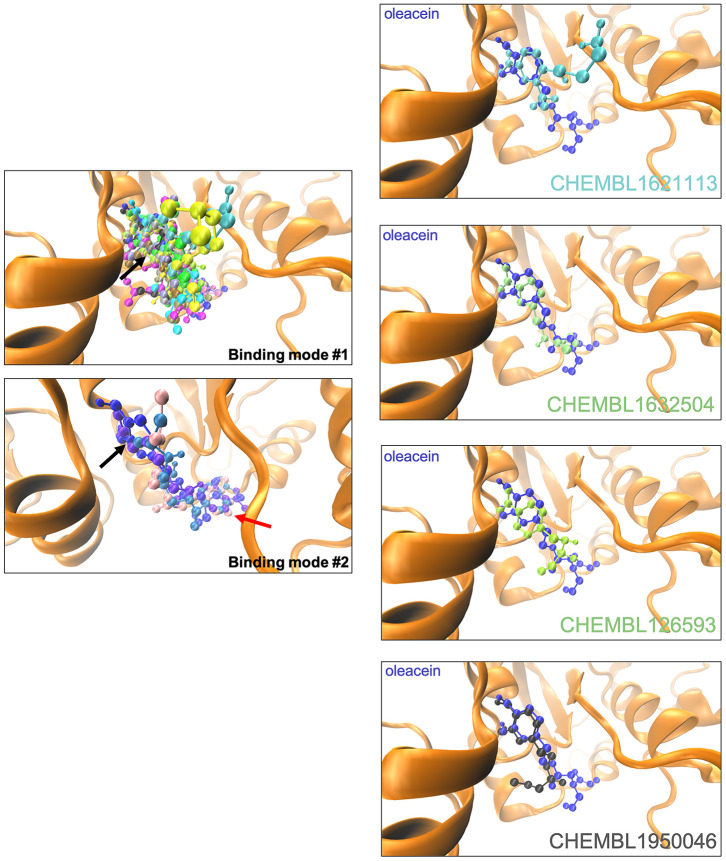
Figure 3.
Binding modes of oleacein mimetics to DNMT. Left panels. Graphical representation of the binding modes of the computationally-predicted oleacein mimetics to the catalytic site of DNMT. The black and red arrows indicate the location of the aromatic rings in the binding modes #1 and #2, respectively. Right panels. Graphical representation of the binding modes of parental oleacein and selected oleacein mimetics with anti-CSC activity (Figures 4 and 5) to the catalytic cavity of DNMT.

