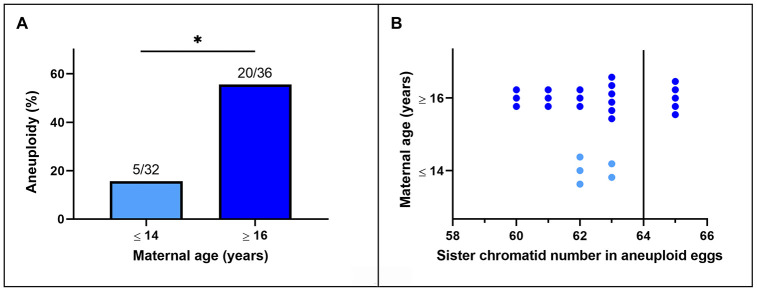
Figure 3.
(A) Incidence of aneuploidy in in vitro matured MII horse oocytes from mares of different ages (*, p< 0.05). Numbers above bars indicate the number of aneuploid oocytes as a proportion of oocytes analyzed. (B) Frequency distribution of sister chromatid counts for the oocytes identified as aneuploid. The vertical line indicates the euploid number.

