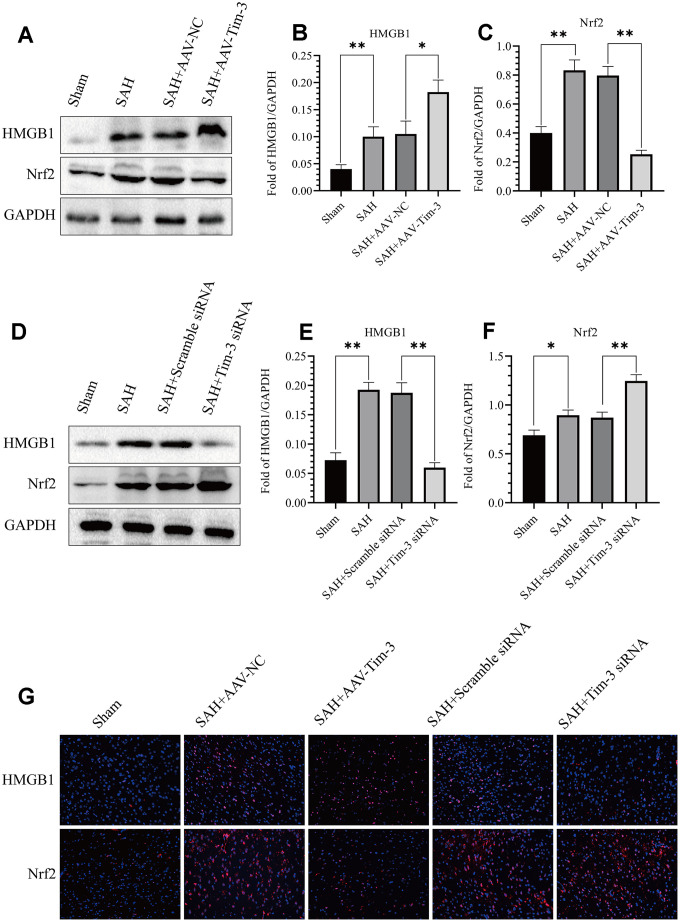
Figure 7.
Effect of AAV-Tim-3 or Tim-3 siRNA on the expression of HMGB1 and Nrf2. Western blot showing that AAV-Tim-3 significantly increased the expression of HMGB1 and reduced the expression of Nrf2, (A) as assessed by quantitative analysis of HMGB1 (B) and Nrf2 (C). Tim-3 siRNA treatment significantly decreased the expression of HMGB1 and increased the expression of Nrf2, (D) as assessed by quantitative analysis of HMGB1 (E) and Nrf2 (F) in the left hemisphere at 24 h post-SAH (n = 6 in each group). Data are expressed as the mean ± SEM. *p < 0.05,**p < 0.01. Representative microphotographs of immunofluorescence staining for HMGB1 and Nrf2 (G) following AAV-Tim-3 or Tim-3 siRNA treatments in the left cerebral cortex at 24 h post-SAH. Scale bar = 50 μm.

