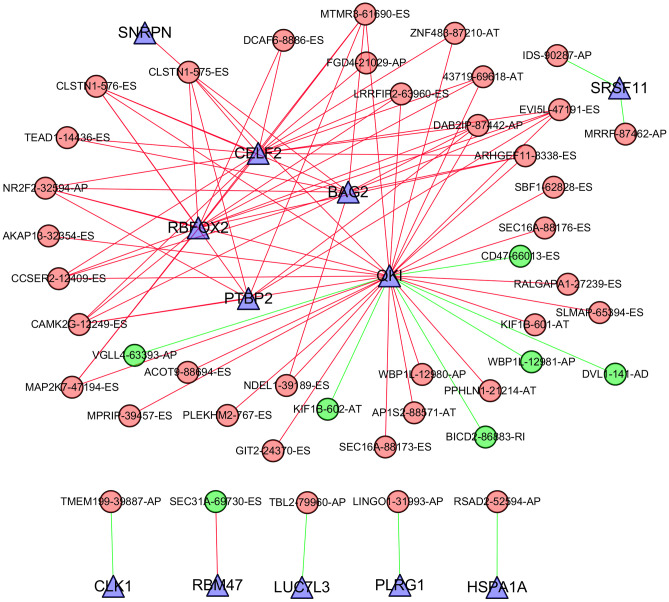
Figure 8.
Correlation network between the expression of splicing factors and PSI values of AS events generated using Cytoscape. Triangle bubbles represent splicing factors. Red/green round bubbles represent adverse/favourable AS events. Red/green lines represent positive/negative correlations between substances.

