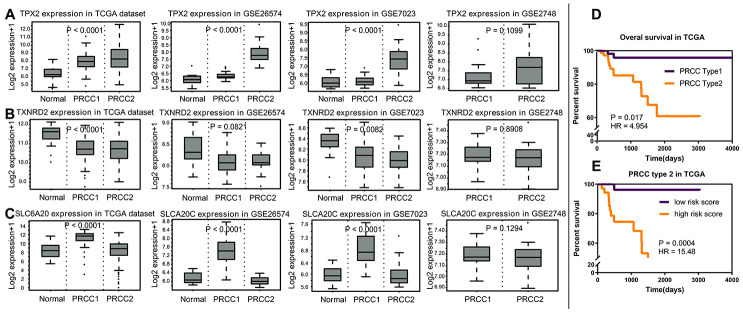
Figure 10.
The analysis of variance of normal renal tissue and papillary renal carcinoma. (A) In TCGA, GSE26574, GSE7023 and GSEA2748, TPX2 acted as prognostic risk factors, upregulated significantly in PRCC2. (B) TXNRD2 acted as prognostic protective factor, downregulated significantly in the PRCC group. (C) SLC6A20 acted as prognostic protective factor, downregulated significantly in the PRCC2 group, compared with PRCC1. (D) PRCC2 showed worse prognosis compared with PRCC1 (P = 0.017; HR = 4.954). (E) Based on the cut off as 4.6846, the PRCC type 2 group patients were divided into two risk groups, and the high-risk group showed the worse prognosis status (P = 0.0004; HR = 15.48).

