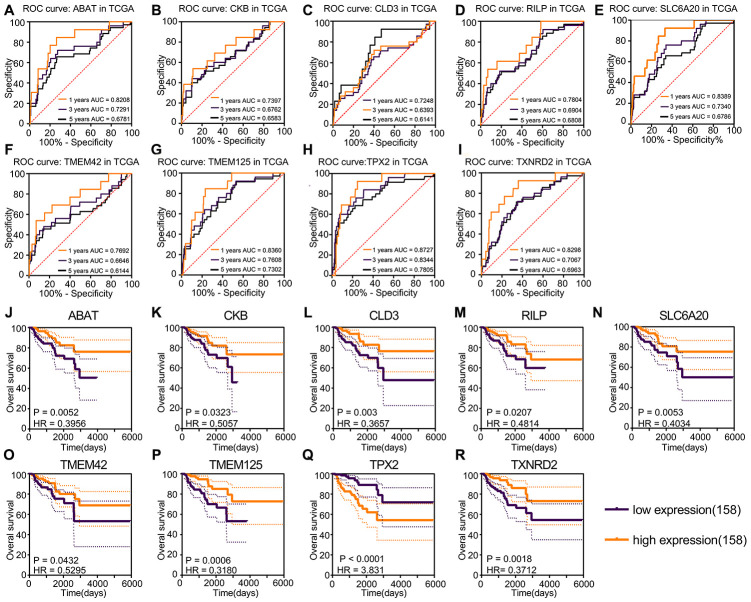
Figure 2.
Kaplan–Meier and ROC curves for prognosis factors generated using the “rbsurv” package. (A–I) The ROC curve of risk factors and protective factors. TPX2 acted as the only risk factor showed the largest AUC, 5-year AUC for TPX2 was 0.7805. ABAT, CKB, CLD3, RILP, SLC6A20, TMEM42, TMEM125 and TXNRD2 acted as protective factors also showed accurate diagnosis ability. (J–R) Kaplan–Meier curves of risk factors and protective factors. The patients were divided into various risk groups according to expression levels. Nine prognostic factors showed significant survival difference and the largest HR was the 3.831 for TPX2, the lowest HR value was 0.3180 for THEM125.

