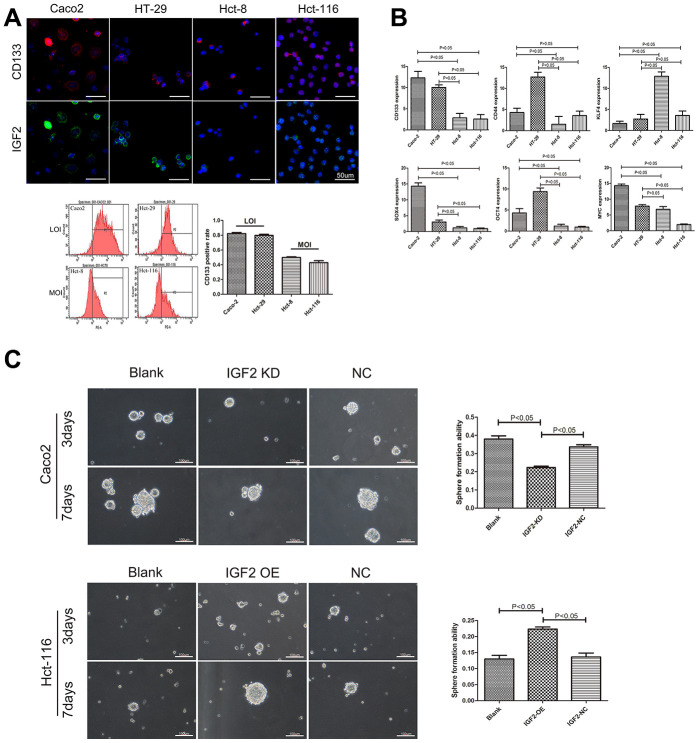
Figure 1.
The association between IGF2 LOI and CSCs characteristics. (A) the correlation between IGF2 LOI and CD133 expression; (B) the mRNA expression of CSCs related genes in IGF2 LOI and MOI CRC cells; (C) the sphere formation assay in IGF2 LOI and MOI CSCs. After 7 days, IGF2 KD cells showed lower sphere formation efficiency than negative control or blank group (cells without any treatment) in IGF2 LOI CSCs(p<0.05). IGF2 OE cells showed higher sphere formation efficiency than negative control or blank group(p<0.05). Sphere forming efficiency = number of actual spheres/number of cells plated×100.

