Figure 2.
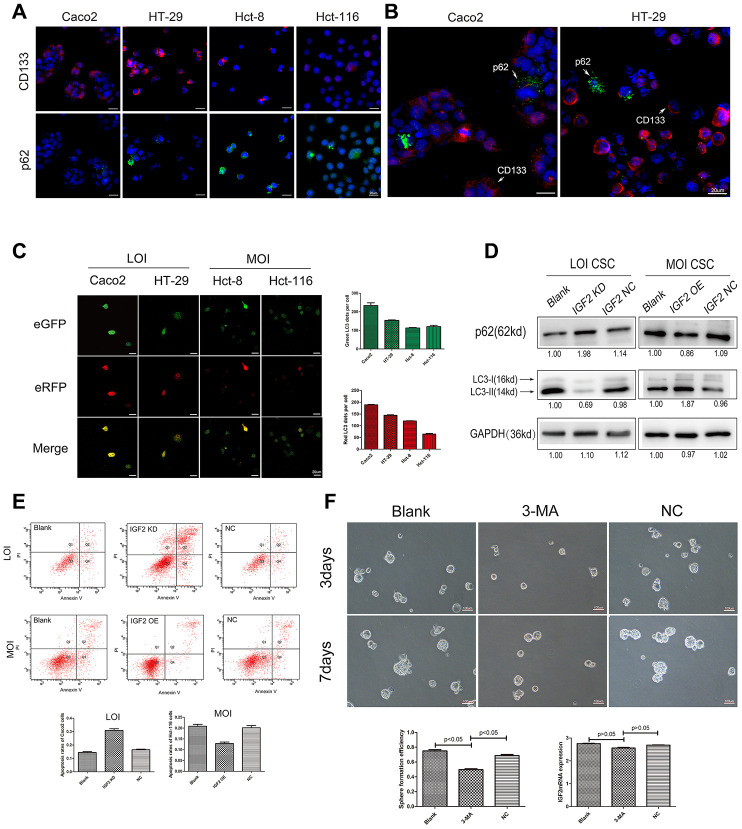
The affection of IGF2 LOI in CSCs autophagy. (A) the IF results of CD133 and p62 in IGF2 LOI cells (Caco2 and HT-29) and MOI cells (Hct-8 and Hct-116); (B) the IF results of p62 in Caco2 or HT-29 CD133+cells and CD133- cells. CD133+ cells showed a lower p62 expression than CD133- cells; (C) the green-puncta and red-puncta numbers of CSCs cells in mRFP-eGFP-LC3fluorescence assay. After hunger for 6 hours, IGF2 LOI CSCs showed higher numbers of green and red LC3 dots per cell than IGF2 MOI cells(p<0.05); (D) the p62 and LC3-II expression in IGF2 LOI and MOI CSCs with different treatment; (E) the apoptosis rates of IGF2 LOI and MOI CSCs with different treatment; (F) the sphere formation efficiency and IGF2 mRNA expression of IGF2 LOI CSCs treated with 3-MA.

