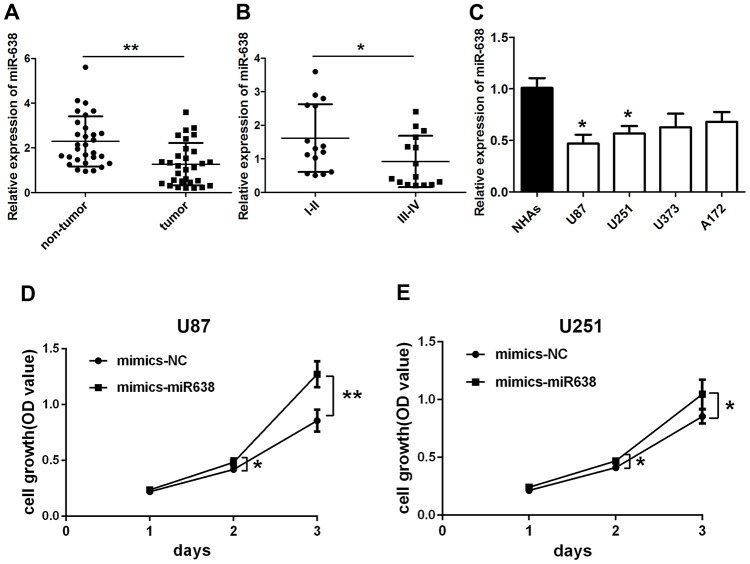
Figure 3.
Overexpression of miR-638 promotes glioma cell growth. qRT-PCR results for (A) miR-638 expression in glioma tumor tissues and their paired adjacent non-tumor tissues. Results represent the mean±SD for three independent experiments (N=30, **p<0.01, as determined by paired Student’s t-test); (B) miR-638 expression in glioma tissues of different grades. Results represent the mean±SD for three independent experiments (N=15 (I-II), N=15 (III-IV), *p<0.05, as determined by unpaired Student’s t-test); (C) miR-638 expression in four glioma cell lines and NHAs cells. Results represent the mean±SD for three independent experiments (*p<0.05, as determined by one-way ANOVA with Dunnett’s multiple comparisons test); (D, E) U87 and U251 cells were transfected with miR-638 mimics. Cell growth was determined using CCK-8 assay. Results represent the mean±SD for three independent experiments (*p<0.05, **p<0.01, as determined by unpaired Student’s t-test).

