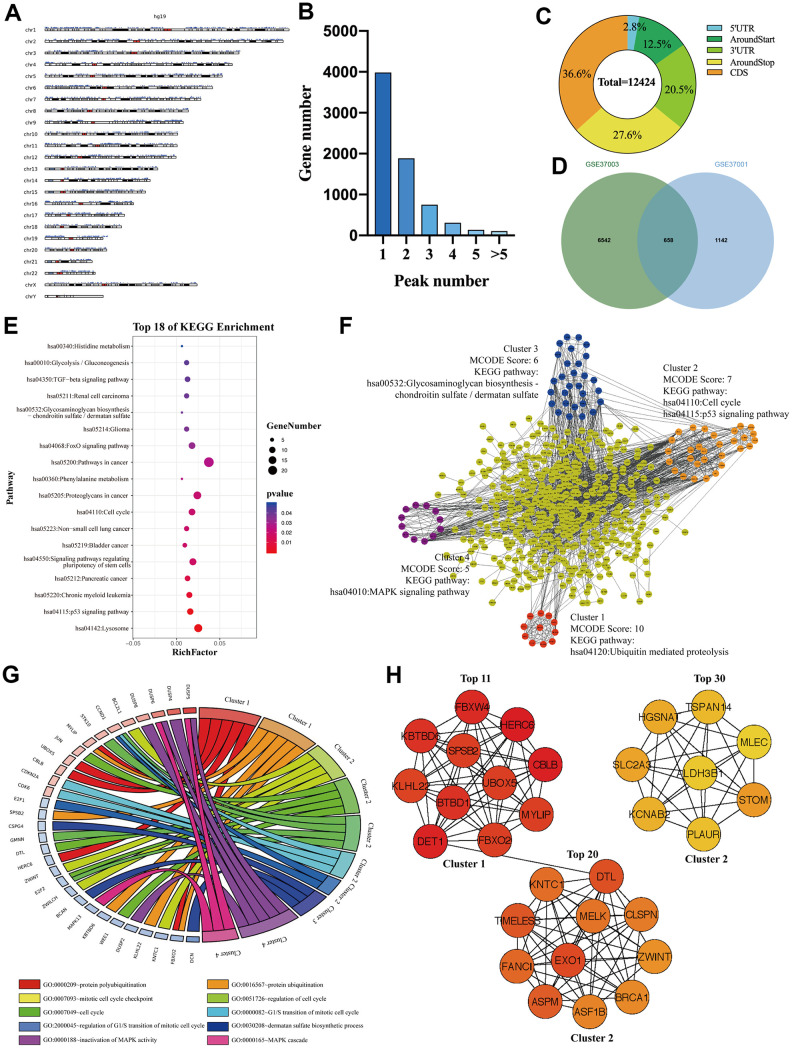
Figure 3.
The signaling pathways and biological processes of m6A modified M3DEGs. (A) The chromosome location of transcripts having m6A peaks in HepG2 cell. (B) The number of genes with various m6A peaks. (C) The distribution of m6A peaks in transcripts. (D) Integrated analysis of M3DEGs and mRNAs with m6A peaks. (E) KEGG pathway analysis of m6A modified M3DEGs. (F, G) KEGG pathway and GO enrichment analysis of functional molecular clusters among the PPI network of m6A modified M3DEGs. (H) The top 30 hub genes among m6A modified M3DEGs.

