Figure 3.
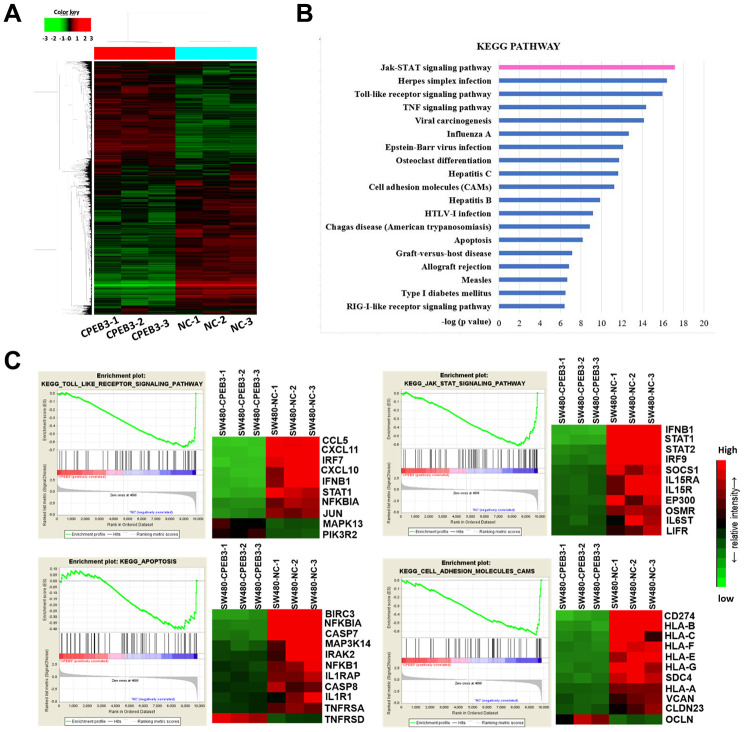
Overexpression of CPEB3 inhibits a cluster of signaling pathways associated with tumor progression in colorectal cancer cells. (A) Microarray analysis was applied to screen the mRNAs which can be regulated by CPEB3. (B) Canonical pathway enrichment of whole genome expression in SW480-CPEB3 and SW480-NC cell lines was analyzed based on KEGG pathway database. (C) Gene set enrichment analysis results for all fold changes calculated between SW480-CPEB3 and SW480-NC cells were shown on the left and the heatmap analysis of genes in each signaling pathway were displayed on the right. Red represents high expression levels and green represents low expression levels.

