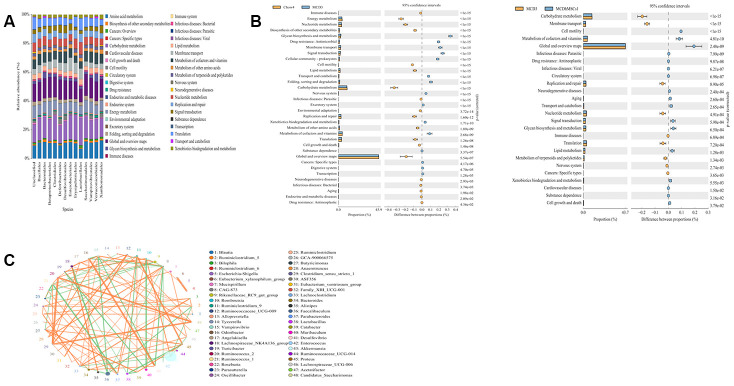
Figure 5.
Human mesenchymal stem cells ameliorated the disorders of metabolomic profiles induced by MCD diet. (A) The expression levels of different species in various metabolic pathways. The x-coordinate represents species of the flora, and the y-coordinate represents the percentage of relative abundance of metabolic pathways. (B) Differences in the metabolic pathways between Chow4 and MCD3; MCD3 and MCD+hMSCs1 were showed in the picture. (C) The interaction among different bacterial communities was represented by Spearman’s rank correlation. Significant associations with P < 0.05 and r > 0.5 were shown. The circle represented species, and the circle size represented the average abundance of species. The line represented the correlation between the two species. The thickness of the line represented the strength of the correlation. The orange color of the line represented positive correlation, whereas green represented the negative correlation.

