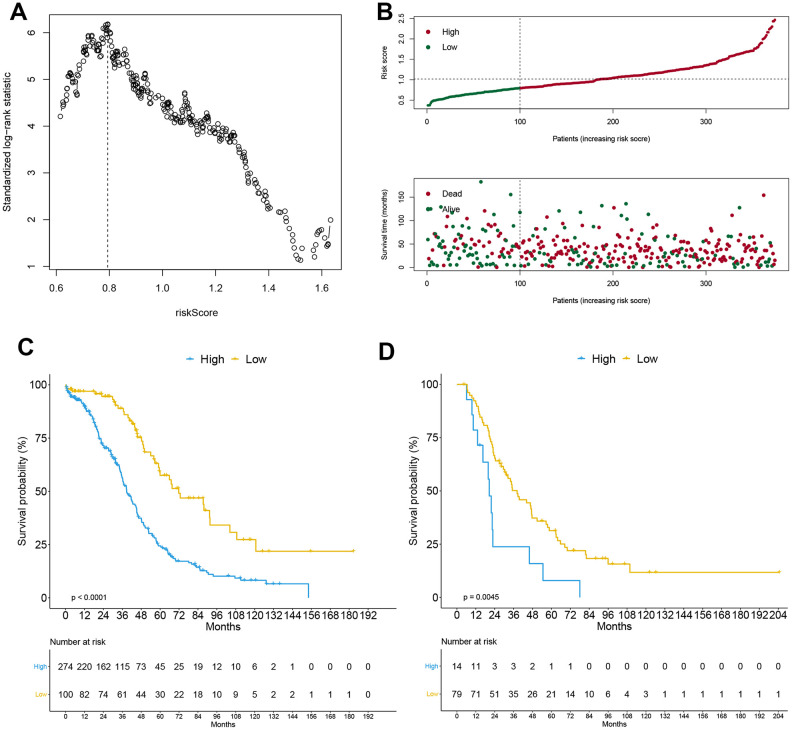
Figure 1.
Construction of APP signature. The optimal cutoff calculated by the maximally selected rank statistics (A), risk score analysis (B) including risk curve and distribution map of survival status in the training cohort, and the Kaplan-Meier curve grouped by APP signature in training cohort (C) and external validation cohort (D).

