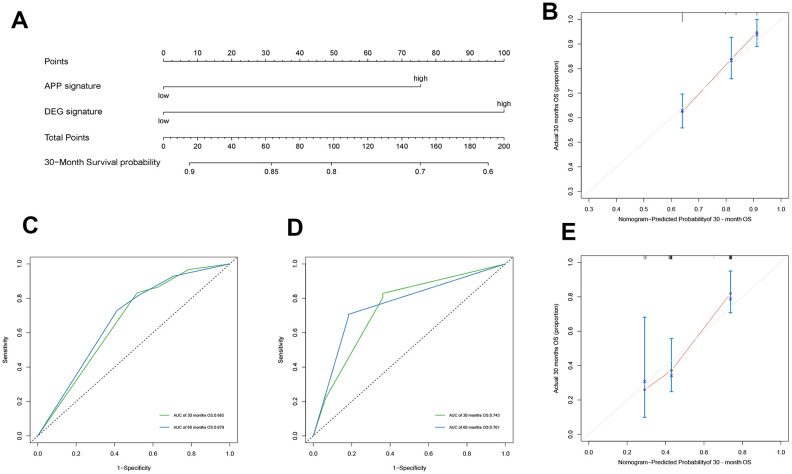
Figure 3.
Construction of nomogram and evaluation of its prediction ability. The nomogram plot (A) composed of APP signature and DEG signature, the calibration curve for the estimation of 30-month survival probability in the training cohort (B) and the validation cohort (C), and the time-dependent ROC of 30 months describe the discriminative ability of the nomogram in the training cohort (D) and the validation cohort (E).

