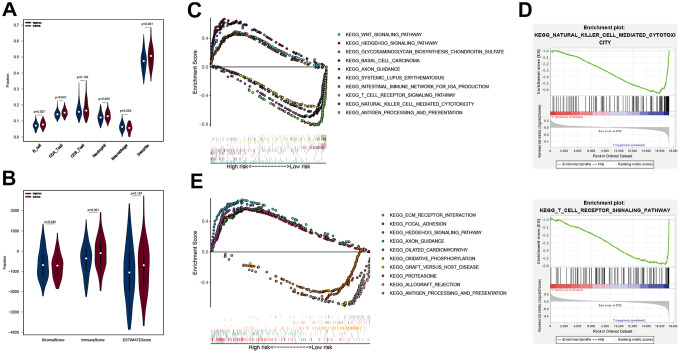
Figure 5.
Analysis of immune cell infiltration and GSEA in different subgroups. The B cell, CD4 T cell, neutrophil and Dendritic scores of the two subgroups in TCGA cohort (A), the StromalScore, ImmunesSore, and ESTIMATEScore of the two subgroups in TCGA cohort (B); ten KEGG pathways analyzed by GSEA (C), in which groups was separated by APP signature, and two immune-related KEGG pathways (D); ten KEGG pathways analyzed by GSEA (E), in which groups was grouped by DEG signature.

