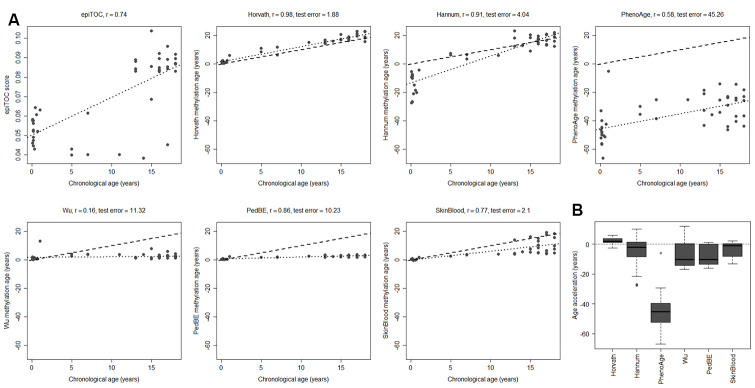
Figure 2.
Performance of seven methylation clocks in healthy pediatric brain tissue. (A) Estimated methylation age (y-axis) vs chronological age (x-axis) in healthy brain tissue from 45 children for all investigated methylation clocks. The dashed line indicates y=x (a perfect correlation between methylation age and chronological age), and the dotted line displays the chronological age to methylation age regression. Test error is defined as the median absolute difference in years between the methylation age and chronological age. (B) Boxplots of age acceleration = methylation age – chronological age.

