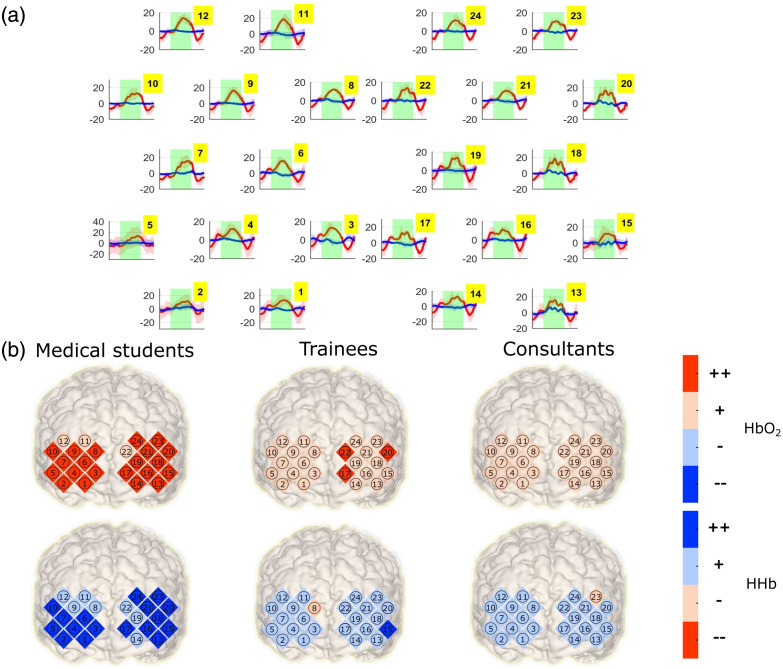
Fig. 3.
Exemplary fNIRS neuroimage of the dataset. (a) Block averaged time courses of the (red) and (blue) block averaging is used here for illustration purposes only, but data analysis proceeded without block averaging. Standard deviations across blocks are represented by shaded reddish and blueish regions, respectively. Green patches indicate the task subperiod. The approximate geometric distribution of the channels during acquisition is respected here. The characteristic increase in coupled with a decrease in associated with functional activation can be appreciated in several channels. Units are [mol]. (b) The activity matrix from a task minus baseline segregational analysis projected on a brain. The projection is approximate according to the locations of the recorded channels (no registration efforts have been made in producing this plot). Brain activity is established by a statistical comparison of the observations during the task and baseline periods. (++) statistically significant increment; (+) nonsignificant increment, (−) nonsignificant decrement, and (–) significant decrement where the significance threshold here has been chosen at .

