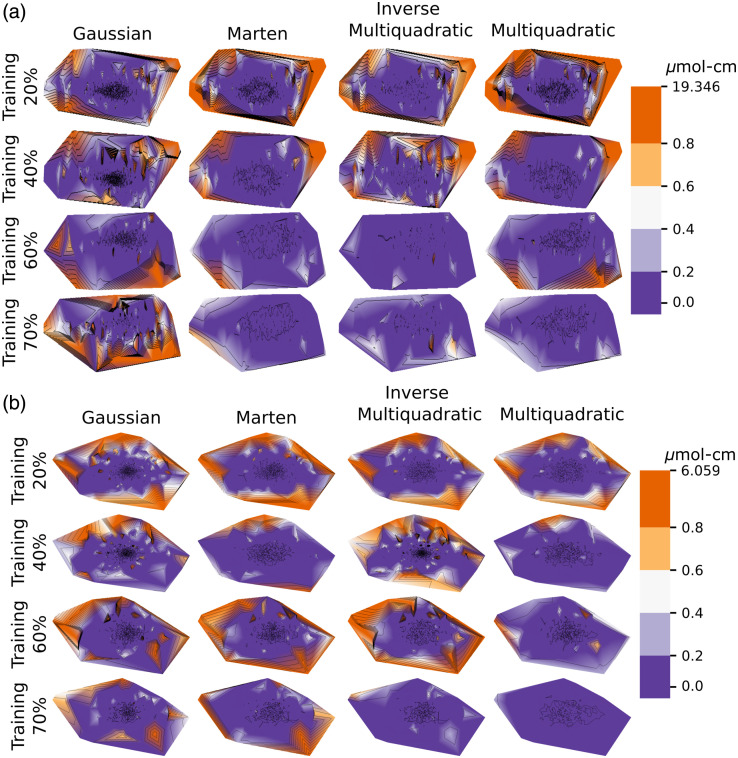
Fig. 6.
Error maps illustrating the difference of the surfaces recovered with subsampling and the full surface. (a) Refers to the difference of surfaces for and (b) To the difference of surfaces for HbR. The absolute error is shown. Error is smaller in the central region of the manifold since this region is densely populated

