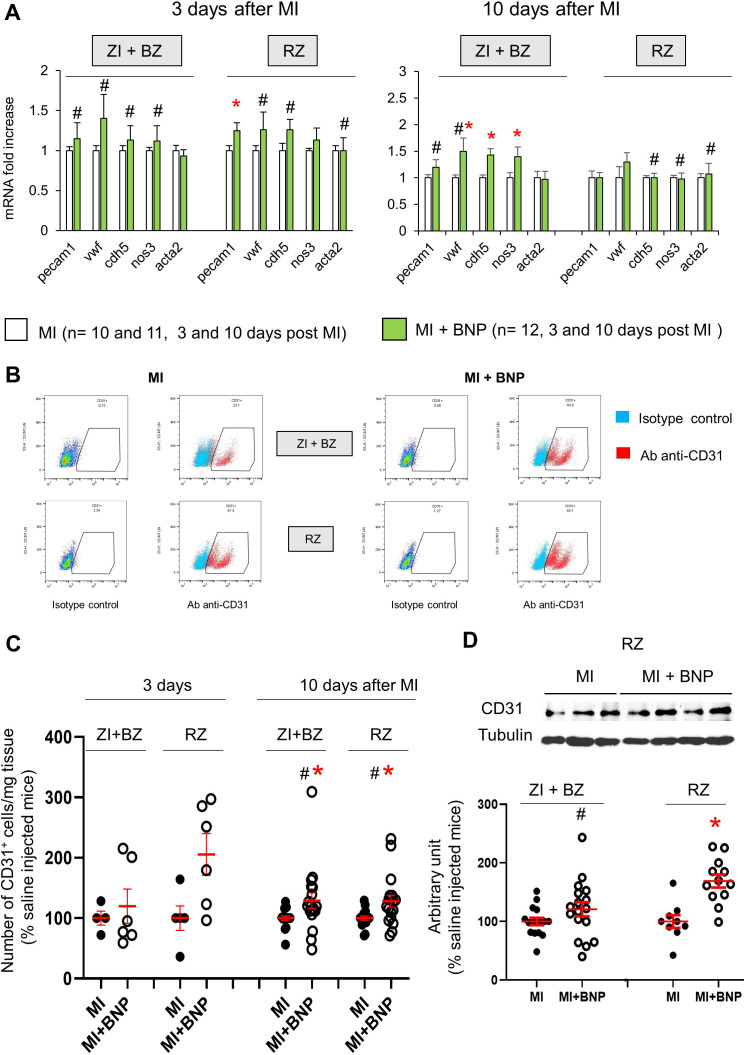
Figure 2. Increased endothelial cell number in infarcted hearts after BNP treatment.
(A) Quantitative relative expression of mRNAs coding for endothelial cell specific proteins (CD31 (pecam1 gene), von Willbrand factor (vwf gene), Ve-cadherin (cdh5 gene), eNOS (nos3 gene)), alpha smooth muscle actin (alpha SMA) (acta2 gene) in the ZI+BZ and RZ areas of saline (MI) and BNP-injected hearts (MI+BNP) 3 and 10 days after surgery. Results expressed as fold-increase above the levels in saline-injected infarcted mice. Results are represented as mean ± SEM. *p<0.05. (B) Representative flow cytometry analysis of NMCs isolated from the ZI+BZ or RZ of infarcted hearts after BNP or saline treatments 10 days after MI. NMCs stained with control isotype or antibody against CD31 protein. Analysis performed on DAPI negative cells (i.e. living cells). (C) Quantification of the data obtained by flow cytometry analysis on NMCs isolated from infarcted hearts 3 and 10 days after MI. The number of CD31+ cell in BNP-treated hearts related to the number obtained in saline-injected hearts. 3 days after MI: n = 4 MI and 6 MI + BNP mice. 10 days after MI: n = 16 MI and 15 MI +BNP mice. (D) Representative western blot of proteins extracted from the ZI+BZ of MI and MI+BNP hearts 10 days after surgery. Blots were stained with antibodies against CD31 and Tubulin (used as loading control). Only the bands at the adequate molecular weight were represented here: Tubulin (55 kDa), CD31 (130 kDa). Quantification of the data from western blot analysis expressed relative to the average of MI hearts. Results were from n = 15–16 different hearts for the ZI+BZ and n = 9–12 hearts for the RZ. (C, D) Individual values are represented and the means ± SEM are represented in red. Statistical analysis was performed only for groups with n ≥ 6. # p<0.05 for different variance between groups, *p<0.05 using unpaired T tests with or without Welch’s corrections.

