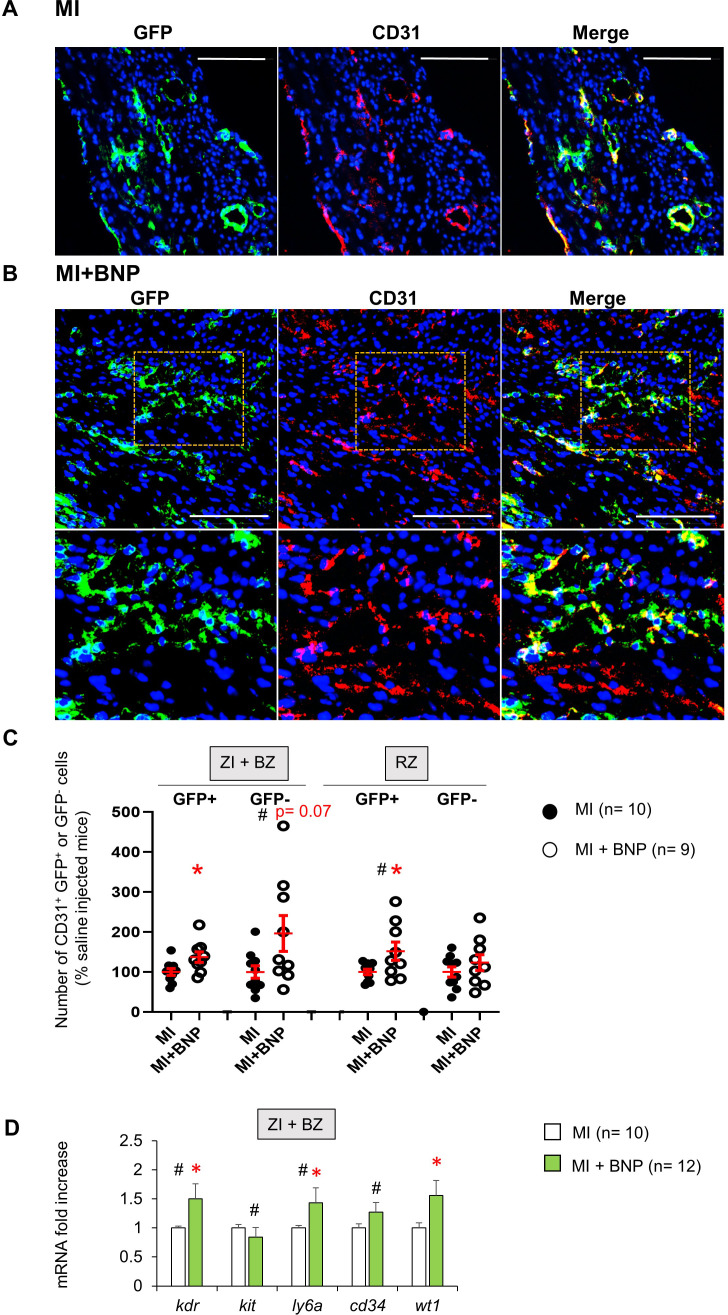
Figure 5. Mobilisation of resident mature endothelial and precursor cells in BNP-treated hearts.
(A) Representative pictures of the ZI+BZ area of Cdh5:ROSA26 infarcted hearts 10 days after surgery, treated (B) or not (A) with BNP and stained with DAPI (nuclei in blue) and antibody against CD31 protein (red). Endothelial cells or cells originating from CD31+ cells express GFP protein. Scale bars represent 100 μm. (B) Orange rectangles are represented at high magnification below. (C) Quantification of the number of GFP+ and GFP- CD31+ cells. Results expressed in BNP-injected mice as fold-increase above the numbers obtained in saline-injected mice. Individual values are represented and the means ± SEM are represented in red. (D) Quantitative relative expression of mRNAs coding for endothelial precursor specific proteins (Flk-1 (kdr gene), c-kit (kit gene), stem cell antigen 1 (Sca-1) (ly6a gene), CD34 (cd34 gene) and Wilms’ tumour 1 (WT1) (wt1 gene)) in ZI+BZ 3 days after MI. Results expressed as fold-increase above the levels in saline-injected mice. Results are means ± SEM. (C–D): # p<0.05 for different variance between groups, *p≤0.05 using unpaired T tests with or without Welch’s corrections.


