. 2020 Nov 27;9:e61050. doi: 10.7554/eLife.61050

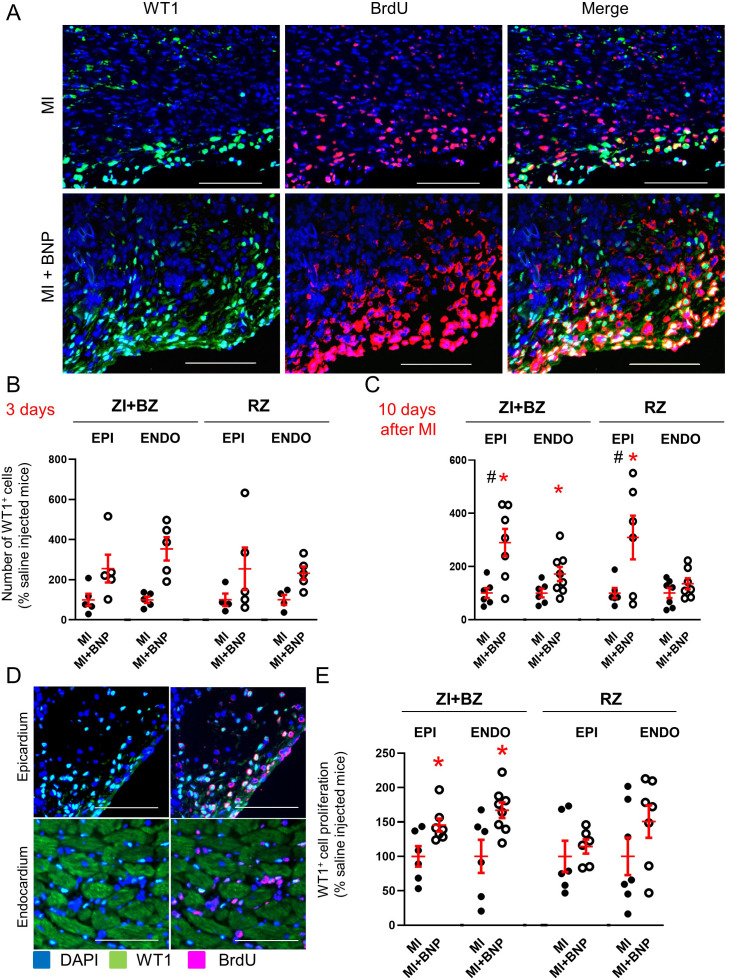
Figure 7. Increased number of WT1+ cells in infarcted BNP-treated hearts.

(A) Representative pictures of the epicardium of the ZI+BZ area of C57BL/6 infarcted hearts treated or not with BNP 10 days after MI and stained with DAPI (nuclei in blue) and antibodies against WT1 protein (green) and BrdU (red). Scale bars: 100 μm. (B–C) WT1+ cell number per pictures in the ZI+BZ and RZ of infarcted hearts treated or not with BNP 3 (B) and 10 (C) days after surgery. (D:) Representative immunostainings of proliferating WT1+ cells in the epicardium and endocardium of the ZI+BZ area of BNP-treated infarcted heart 10 days after MI. Scale bars: 100 μm. (E) Percentages of proliferating WT1+ cells (number of WT1+BrdUcells/total number of WT1+ cells) 10 days after MI. B, C, E: Results obtained in the epicardium separated from those obtained in the endocardium. Individual values are represented and the means ± SEM are represented in red. # p<0.05 for different variance between groups, *p≤0.05 using unpaired T tests with or without Welch’s corrections only for groups with n ≥ 6. EPI: epicardium, ENDO: endocardium.

Figure 7.

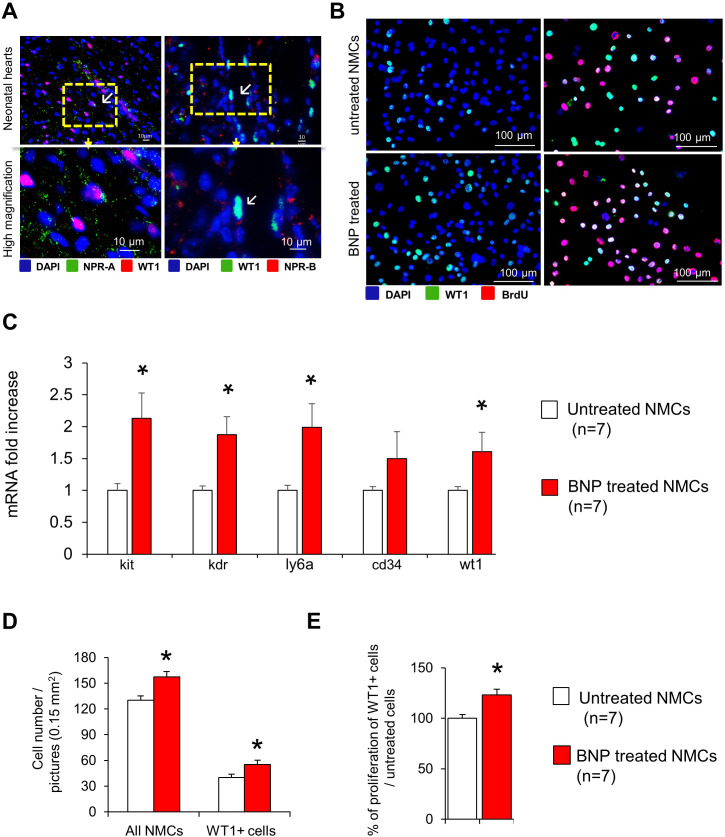
Figure 7—figure supplement 1. BNP treatment stimulated WT1+ cell proliferation in vitro.

Figure 7—figure supplement 1.

(A) WT1+ cells isolated from neonatal hearts express NPR-A and NPR-B. ( B). Representative immunostainings of NMC cultures treated or not with BNP (5 mg/ml) and stained with DAPI (Nuclei in blue), antibodies against WT1 (green) and BrdU (red). (C) Quantitative relative expression of mRNAs coding for endothelial precursor specific genes (Flk-1, c-kit, stem cell antigen 1 (Sca-1), CD34 and Wilms’ tumour 1 (WT1)) in NMCs isolated from neonatal hearts and treated or not with BNP (5 mg/ml) for 10 days. Results expressed as fold-increase above the levels in untreated cells. (D) Quantification of the number of WT1+ cells per pictures (0.15 mm2) after 7–10 days of culture. At least 10 different pictures were evaluated per cell culture. (E) The percentages of WT1+ cell proliferation were obtained by dividing the number of WT1+ BrdU+ cells per the total WT1+ cell number. Results expressed as fold-increase above the levels in untreated cells All the results are means ± SEM, *p<0.05 using paired Student T test.