. 2020 Nov 27;9:e60535. doi: 10.7554/eLife.60535

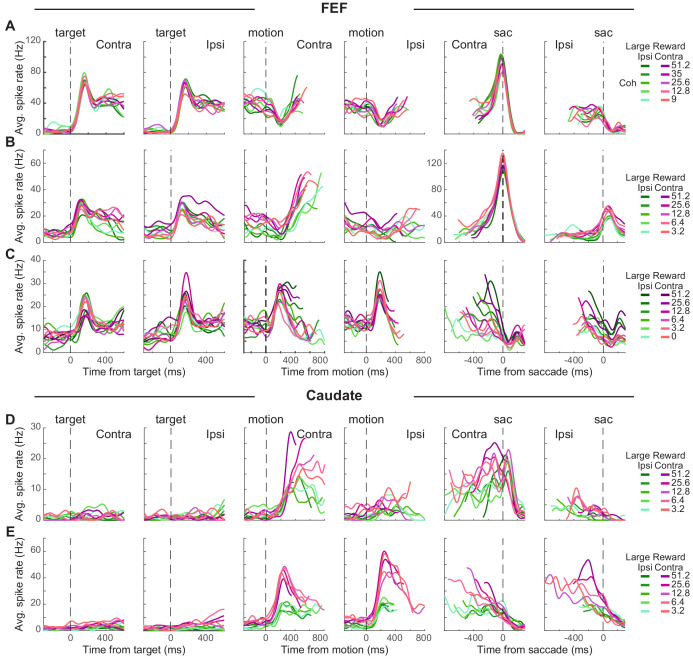
Figure 2. Task-related activity in FEF and caudate neurons.

(A-C) Activity of three example FEF neurons. For display purposes, average spike count was measured for correct trials only and convolved with a Gaussian kernel (sd = 40 ms). Green colors: large reward was paired with the ipsilateral choice. Red colors: large reward was paired with the contralateral choice. Shades: coherence levels. For alignment to motion onset, activity was truncated at 100 ms before the median reaction time. For alignment to saccade onset, activity was truncated at 200 ms after the median time for motion onset. (D-E) Activity of two example caudate neurons. Same format as A.

Figure 2.

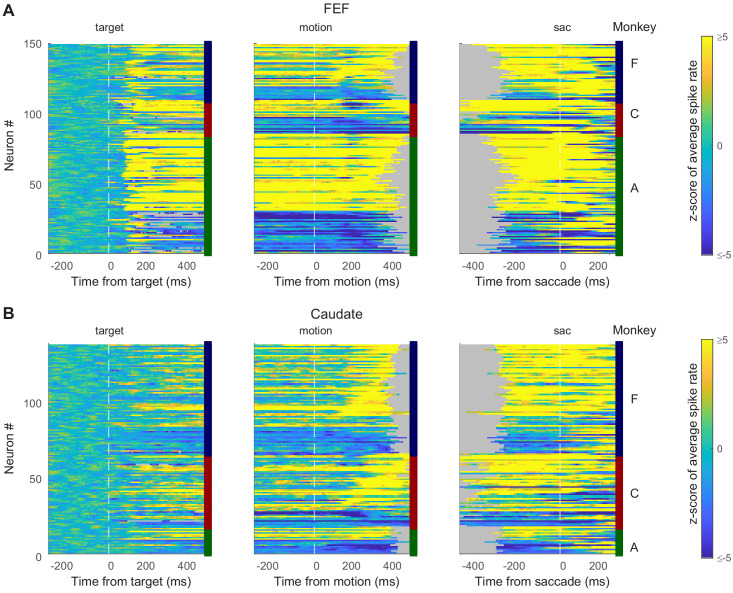
Figure 2—figure supplement 1. Summary of activity patterns.

Figure 2—figure supplement 1.

(A) Summary of average activity for each time point during a trial for all FEF neurons (n = 149). Activity was averaged between the two choices and z-scored to baseline activity (average activity in a 300 ms window before target onset). Non-gray colors: z-score as in the color bar, bounded at ±5. Gray: truncated data as in Figure 2. The bars to the right of each panel indicate the monkey identities for the neurons. Neurons are sorted by the timing and sign of peak modulation in the middle column, separately for each monkey. (B) Summary for caudate neurons (n = 140). Same format as A.