. 2020 Nov 27;9:e60535. doi: 10.7554/eLife.60535

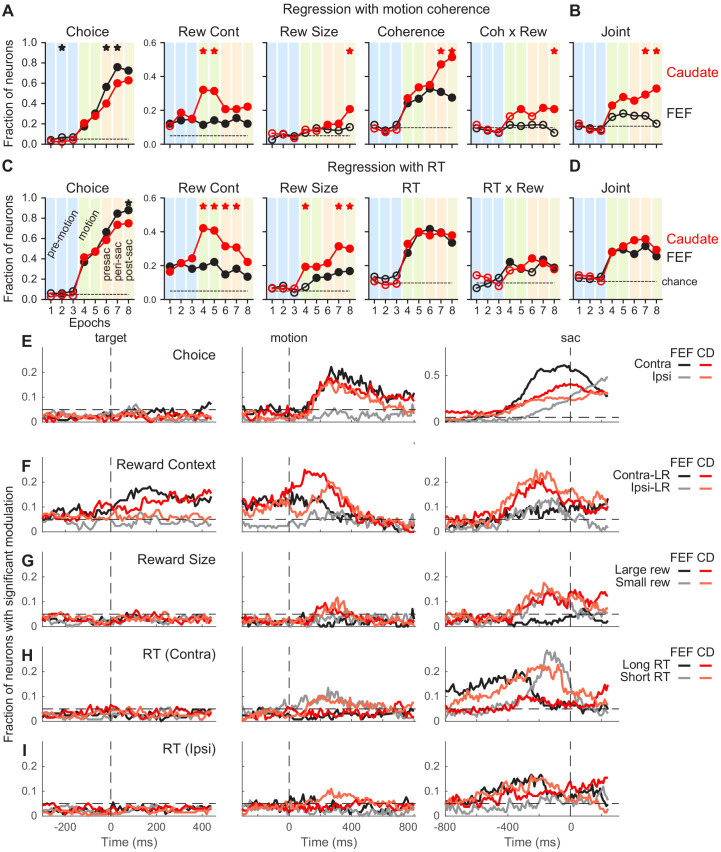
Figure 3. Comparison of task-related modulation of FEF and caudate activity.

(A) Fractions of FEF (black) and caudate (red) neurons showing significant regression coefficients in the multiple linear regression in Equation 2. Criterion: t-test, p<0.05. Dashed lines: chance level, adjusted for the number of comparisons. Filled circles: the fraction was significantly greater than chance level (Chi-square test, p<0.05/72 (8 epochs x nine comparisons)). ‘Coherence’ and ‘Coh x Rew’: neurons with significant coefficients for either choice. Vertical color bars indicate epochs defined in Figure 1A. Stars indicate epochs in which the fractions differed between FEF and caudate populations (Chi-square test, p<0.05/72). (B) Fraction of neurons with joint modulation by coherence and reward-related terms. Same format as A. (C, D) Fractions of neurons showing significant regression coefficients in the multiple linear regression in Equation 3. Same format as A and B. (E-I) Fractions of neurons showing significant non-zero regression coefficients for different regressors (Equation 3). Results from RT-reward interaction terms were omitted because both regions showed near chance-level fractions. Dashed horizontal lines: chance level. Only neurons tested with non-vertical motion stimuli were included (n = 126 and 136 for FEF and caudate, respectively).

Figure 3—source data 1. Source data for Figure 3A–D.
Figure 3—source data 2. Source data for Figure 3E–I: FEF activity aligned to target onset.
Figure 3—source data 3. Source data for Figure 3E–I: caudate activity aligned to target onset.
Figure 3—source data 4. Source data for Figure 3E–I: FEF activity aligned to motion onset.
Figure 3—source data 5. Source data for Figure 3E–I: caudate activity aligned to motion onset.
Figure 3—source data 6. Source data for Figure 3E–I: FEF activity aligned to saccade onset.
Figure 3—source data 7. Source data for Figure 3E–I: caudate activity aligned to saccade onset.

Figure 3.

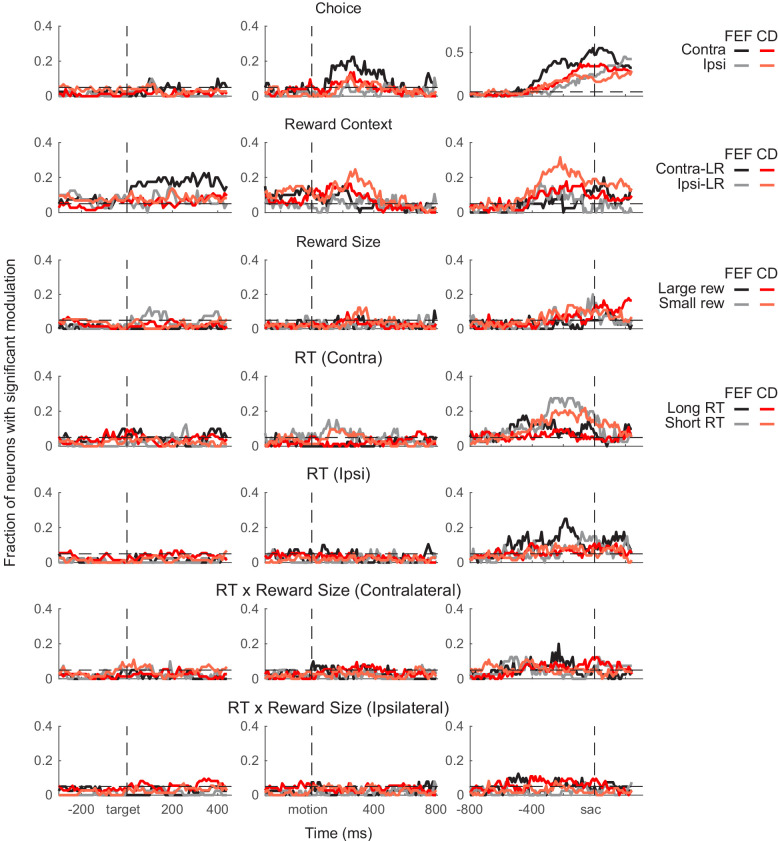
Figure 3—figure supplement 1. Comparison of the time course of task-related modulation of FEF and caudate activity in monkey F.

Figure 3—figure supplement 1.

Fractions of neurons showing significant non-zero regression coefficients for different regressors (Equation 3). Same format as Figure 3E. N = 40 and 73 for FEF and caudate, respectively.
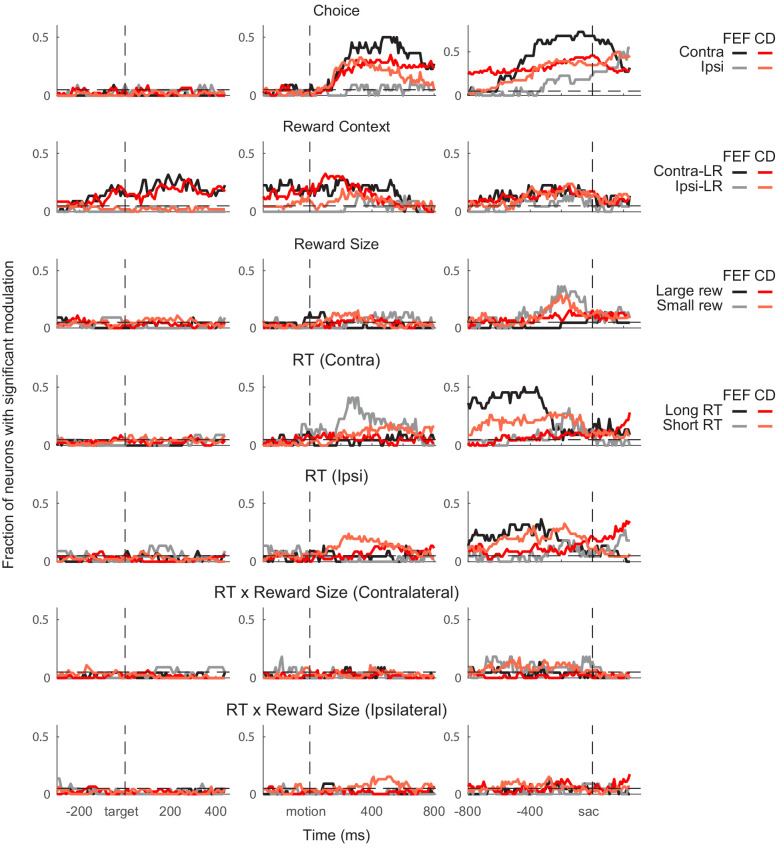
Figure 3—figure supplement 2. Comparison of the time course of task-related modulation of FEF and caudate activity in monkey C.

Figure 3—figure supplement 2.

Fractions of neurons showing significant non-zero regression coefficients for different regressors (Equation 3). Same format as Figure 3E. N = 22 and 46 for FEF and caudate, respectively.
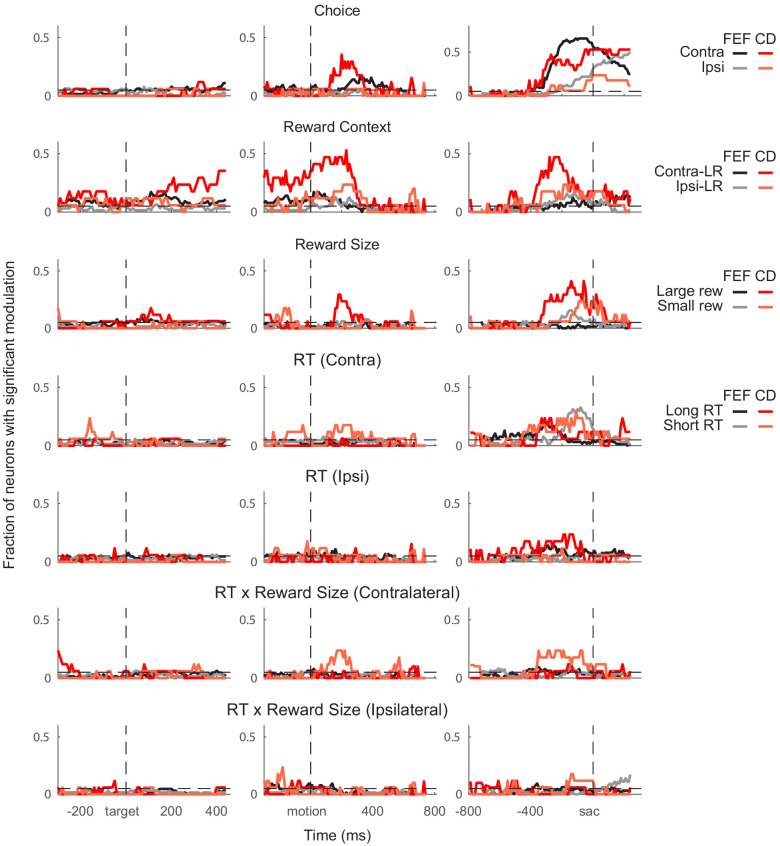
Figure 3—figure supplement 3. Comparison of the time course of task-related modulation of FEF and caudate activity in monkey A.

Figure 3—figure supplement 3.

Fractions of neurons showing significant non-zero regression coefficients for different regressors (Equation 3). Same format as Figure 3E. N = 64 and 17 for FEF and caudate, respectively.
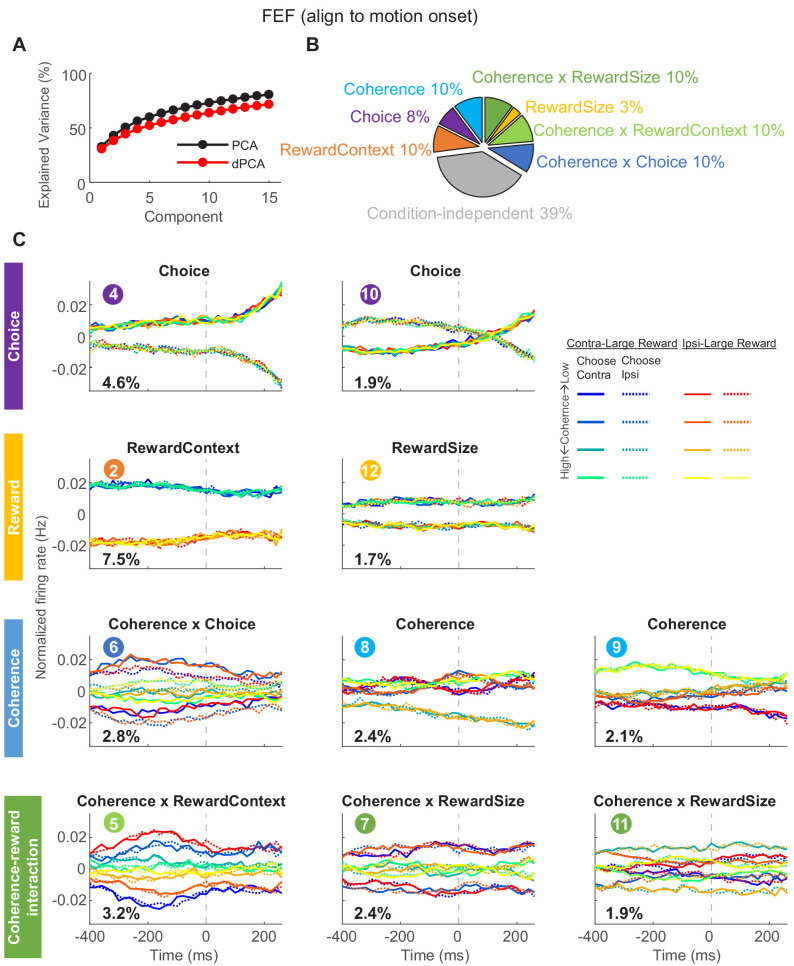
Figure 3—figure supplement 4. dPCA results for FEF activity aligned to motion onset.

Figure 3—figure supplement 4.

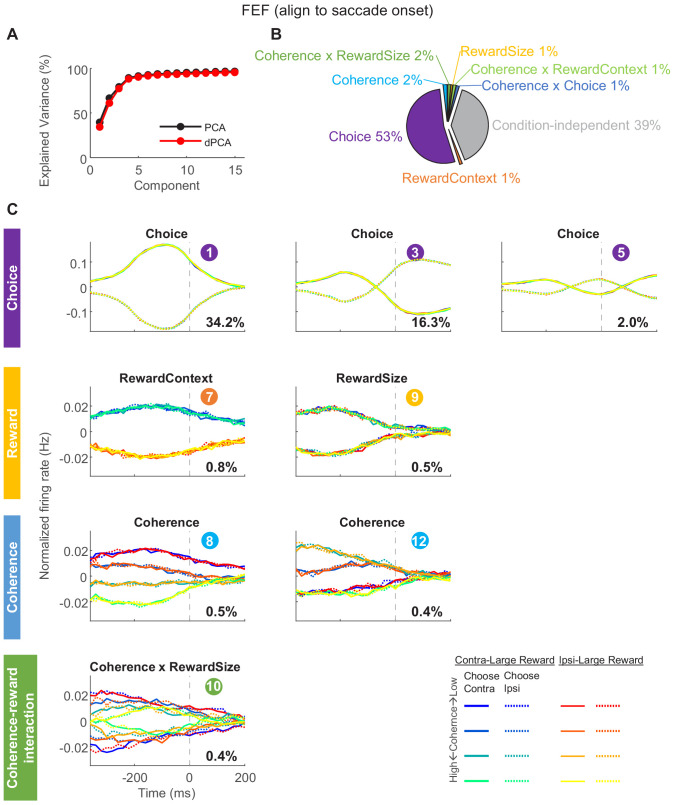
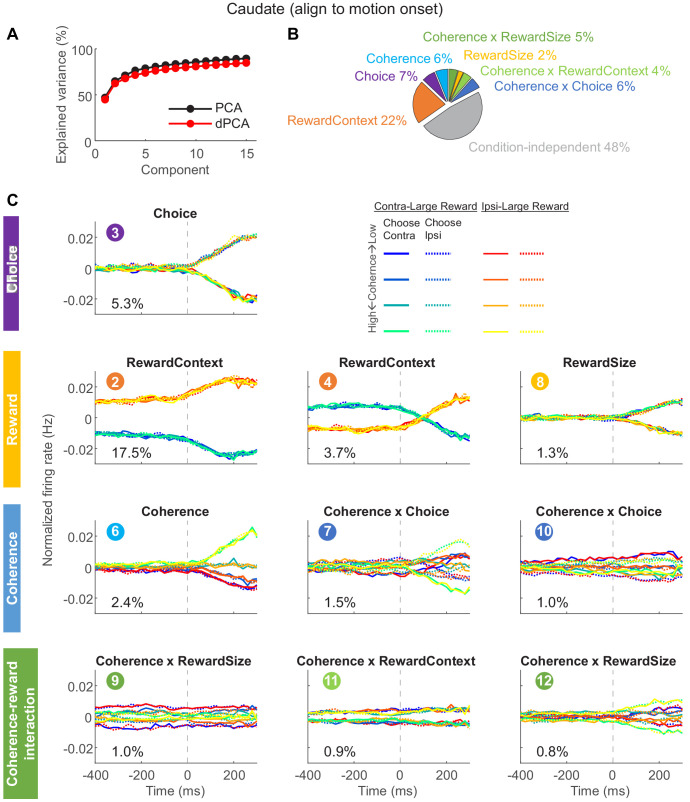
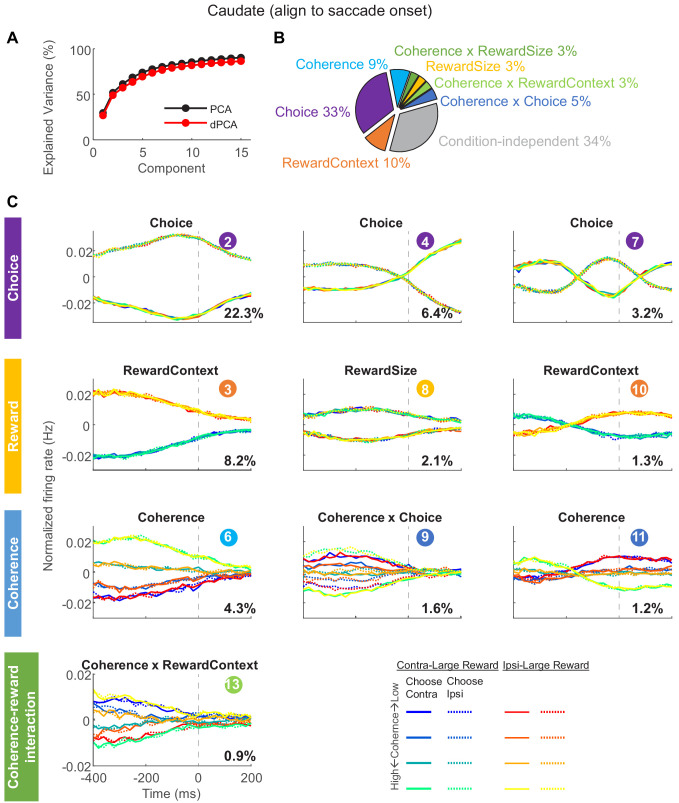
(A) Cumulative variance explained by PCA (black) and dPCA (red) by the first 15 components. (B) Percentage of explained variance by different dPCA components, marginalized by task parameters. (C) Top 10 dPCA components with the highest explained variance (exlucding condition-independent components). In each subplot, the data were projected onto the respective dPCA decoder axis, with 16 lines corresponding to 16 conditions (see legend). The ordinal numbers of the components are shown in the colored circles. The percent explained variance for each component is shown at the left bottom corner.
Figure 3—figure supplement 5. dPCA results for FEF activity aligned to saccade onset.

Figure 3—figure supplement 5.

Figure 3—figure supplement 6. dPCA results for caudate activity aligned to motion onset.

Figure 3—figure supplement 6.

Figure 3—figure supplement 7. dPCA results for caudate activity aligned to saccade onset.

Figure 3—figure supplement 7.