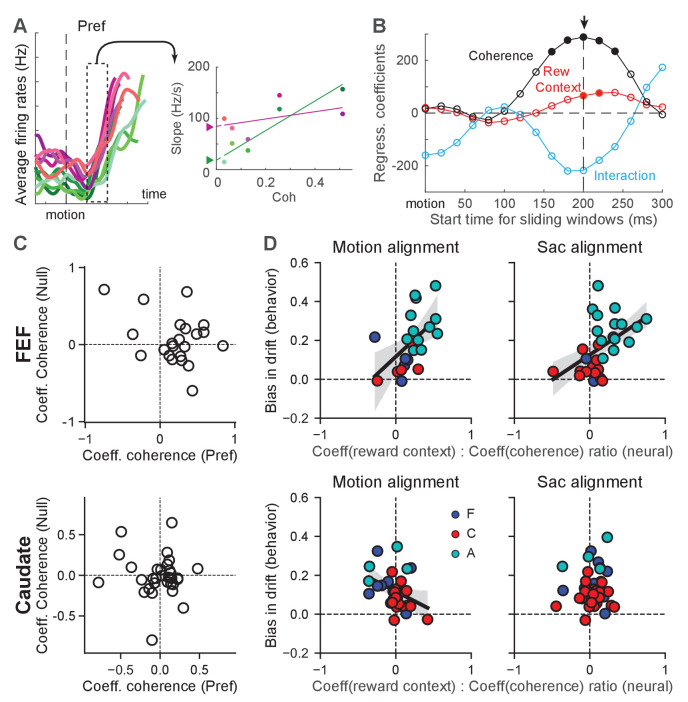
Figure 6. Reward-context modulation of the rate of change in FEF more closely reflected reward bias in drift rates.
(A) Illustration of measurements of different modulations of the rate of change for a single neuron. Left: average firing rates of the example neuron in Figure 2B for its preferred choice and aligned to motion onset. In 200 ms sliding windows, linear regressions were performed to estimate the slope of firing-rate changes as a function of time, coherence, reward context and their combination. Right: slope values for the sliding window in the left panel. A multiple linear regression was performed with coherence, reward context and their interaction as the regressors (lines). The offset between the two reward contexts at zero coherence (filled triangles) represents the magnitude of reward-context modulation in the regression. (B) The regression coefficients of the linear regression for different sliding windows for the example neuron. Filled circle: coefficient was significantly different from zero (t-test, p<0.05). For each neuron, the time with the largest absolute coherence modulation was identified (arrow). For the alignment to motion onset, a minimum 100 ms visual latency was imposed. (C) Coefficient values for FEF (top) and caudate (bottom) neurons with significant coherence-modulated slope values for trials with the preferred choices. (D) Scatter plots of the ratio of regression coefficients for reward context and coherence modulation (abscissa) and the behavioral bias in drift rates (from DDM fits, ordinate), for FEF (top) and caudate (bottom) neurons with significant coherence modulation. Preferred choice only. Slope values were measured from activity aligned to motion (left) and saccade (right) onset. Line and shaded area: linear regression with significant non-zero slope (t-test, p<0.05) and 95% confidence interval. Colors indicate neurons from the three monkeys.


