. 2020 Nov 10;9:e58178. doi: 10.7554/eLife.58178

Figure 5. Deletion intervals and differential expression of genes at the 16p11.2 locus.

See also Supplementary files 5 and 6; Figure 5—figure supplements 1, 2, 3 and 4. (A) PCA of variance-stabilized count data after normalization and batch correction reveals that samples cluster by 16p11.2 deletion status within the first two PCs. Axes represent the first two principal components (PC1, PC2). (B) RLG normalized counts of each transcript within the 16p11.2 interval. WT = black symbols, DEL = red symbols, transcripts not detected = gray symbols. (C) Known deletion intervals in integration-free hiPSC clones that were included in the RNA-seq analysis of differentially expressed genes within the 16p11.2 locus. NA, breakpoint information was not available from the Simons Foundation. (D) Canonical gene symbols located between chromosome 16 location 28,800,000 and 30,400,000. Transcripts that reach significance as differentially expressed between WT and DEL clones (FDR < 0.05) are indicated in red. Labels for transcripts that were below detection limits are marked in light gray. (E) Differentially expressed genes that are up- or downregulated at least 1.5-fold. Red lines represent threshold of 1.5-fold change. Genes falling within the 16p11.2 deletion region are highlighted. (F) VST-normalized and batch corrected expression for all genes across all WT clones (X-axis) and DEL clones (Y-axis). Highlighted points represent 16p11.2 region genes that were either called differentially expressed (Red) or not differentially expressed in our pipeline (Orange). (G) Heatmap of gene expression for all the differentially expressed genes identified with DESeq2. Fill values represent counts that have been normalized and scaled using a variance-stabilizing transformation implemented by DESeq, and batch effect corrected using limma and SVA. Sex of the subject is indicated on the left.

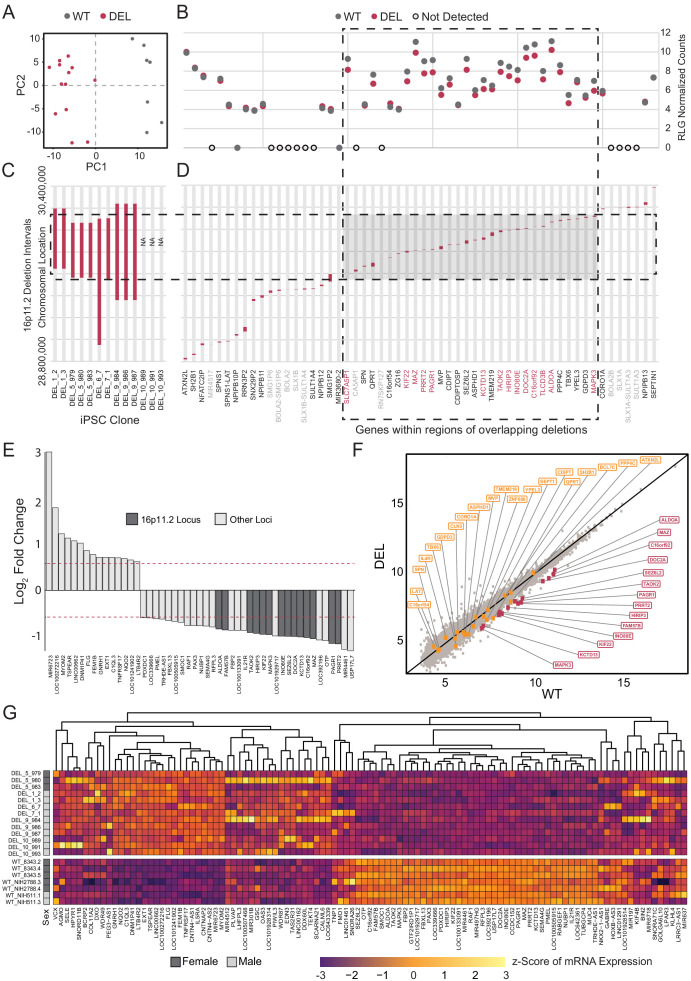
Figure 5.

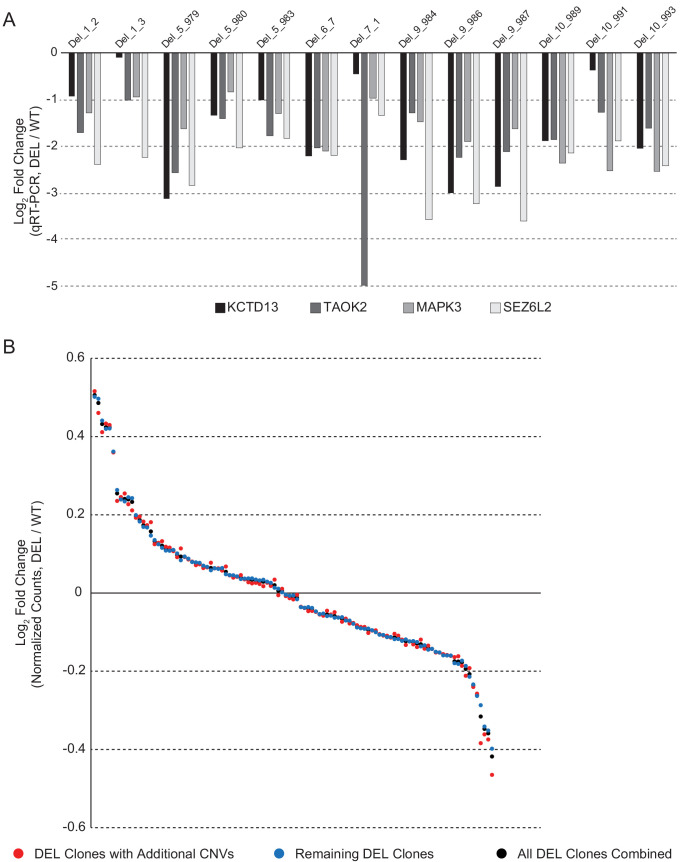
Figure 5—figure supplement 1. Validation of differentially expressed 16p11.2 interval genes.

Figure 5—figure supplement 1.

(A) qPCR validation of the 16p11.2 interval genes KCTD13, TAOK2, MAPK3 and SEZ6L2 showing a reduction in gene expression in all the DEL lines. Data are expressed as a log2 fold change compared to the average expression of these genes across all WT hiPSC lines. (B) Concordance in DE gene fold change among four clones that have a microdeletion in 14q11.1, a microduplication in 14q11.2, and a microdeletion in 7p11.2, relative to remaining clones and relative to the average of all DEL clones combined. Each dot represents the value for a given DE gene. DE genes were ranked in order of highest fold increase to largest decrease.
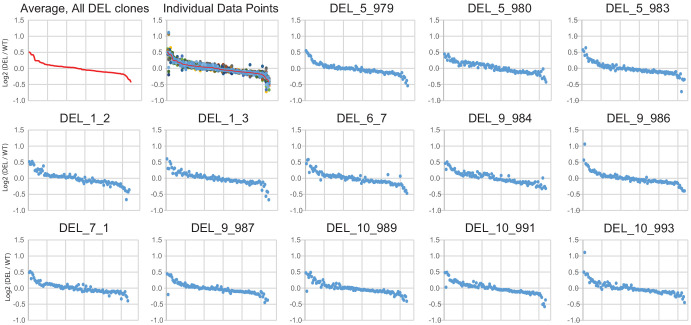
Figure 5—figure supplement 2. Concordance of differentially expressed gene changes across individual clones.

Figure 5—figure supplement 2.

Log2(DEL/WT) for normalized counts is plotted for the average across all DEL clones (first panel, red symbols) or individually for each DE gene in each clone. The second panel overlays the average change for all DEL clones (red) on top of all individual values for each DE gene in each DEL clone. Remaining panels plot each DE gene for individual DEL clones. Genes are rank ordered in all plots from largest increase to largest decrease from left to right (the same order is used in all plots). All plots are calculated as DEL values relative to average expression in the combined WT clones.
Figure 5—figure supplement 3. DAVID gene enrichment analysis for differentially expressed genes.

Figure 5—figure supplement 3.

(A) Disease categories observed in the differentially expressed gene list, ordered by unadjusted p-value, and associated number of genes in each category. Categories that are enriched following Bonferroni correction for multiple hypothesis testing correction are colored dark gray. (B) Gene Ontology (GO) term categories in the differentially expressed gene list, ordered by unadjusted p-value, and associated number of genes in each category.
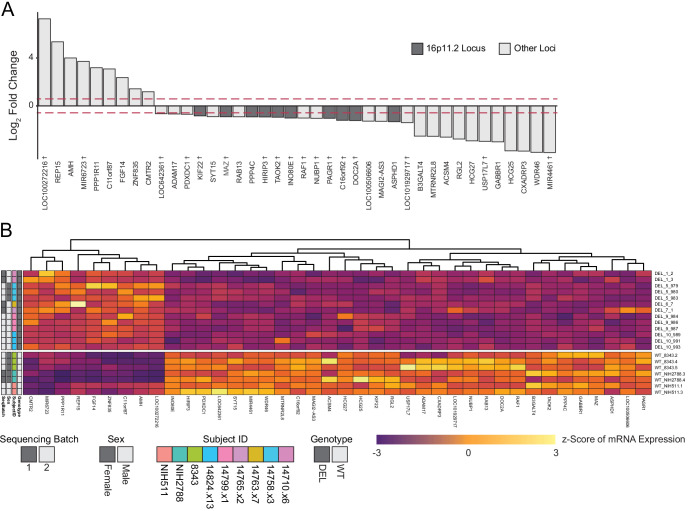
Figure 5—figure supplement 4. Differential expression analysis with a linear mixed model to account for shared patient identity across clones.

Figure 5—figure supplement 4.

(A) Differentially expressed genes identified using a limma/voom differential expression pathway that are up- or downregulated at least 1.5-fold. Red lines represent threshold of 1.5-fold change. Genes falling within the 16p11.2 deletion region are highlighted. Genes which were also identified in Figure 5E are denoted by a cross. (B) Heatmap of gene expression for all the differentially expressed genes identified with the limma/voom pipeline. Fill values represent the Z-score of counts per million (CPM)-normalized and batch corrected expression values. Sequencing Batch, Sex, Subject ID, and Genotype are indicated on the left.