
Figure 6. WGCNA reveals modules of co-expressed genes in integration-free clones that correlate with patient clinical features.
See also Supplementary file 7; Figure 6—figure supplements 1, 2 and 3. (A) Heatmap of p-values assessing the significance of module-trait correlations. Values represent a scaled p-value equal to (−1 * log10(p-value)). P-values that fall outside of the significance threshold of p<0.05 are colored gray. WGCNA-produced module color labels are annotated on the X-axis, with red text indicating 20 modules with p<0.05. (B) Depiction of annotations identified as statistically significant (FDR < 0.25) in GSEA for the set of genes identified by WGCNA as the gene networks within the clinical trait-associated modules with highest significance: pink4, salmon, bisque4, and blue (modules represented in the last four columns of panel A). (C) Categories of pathways identified as upregulated among significantly trait-associated module genes by GSEA according to frequency. Enriched pathways identified by GSEA were assigned to categories based on their Gene Ontology relations. (D) Categories of pathways identified as upregulated among significantly trait-associated module genes by GSEA according to normalized enrichment score (NES). Enriched pathways identified by GSEA were assigned to categories based on their Gene Ontology relations. (E) Heatmap of scaled VST-normalized, batch-corrected expression values for genes identified as members of the pink4 module by WGCNA. Phenotype annotations are indicated on the Y-axis.

Figure 6—figure supplement 1. Visualization of module membership (MM) and gene-trait significance (GS) for modules with statistical significance.
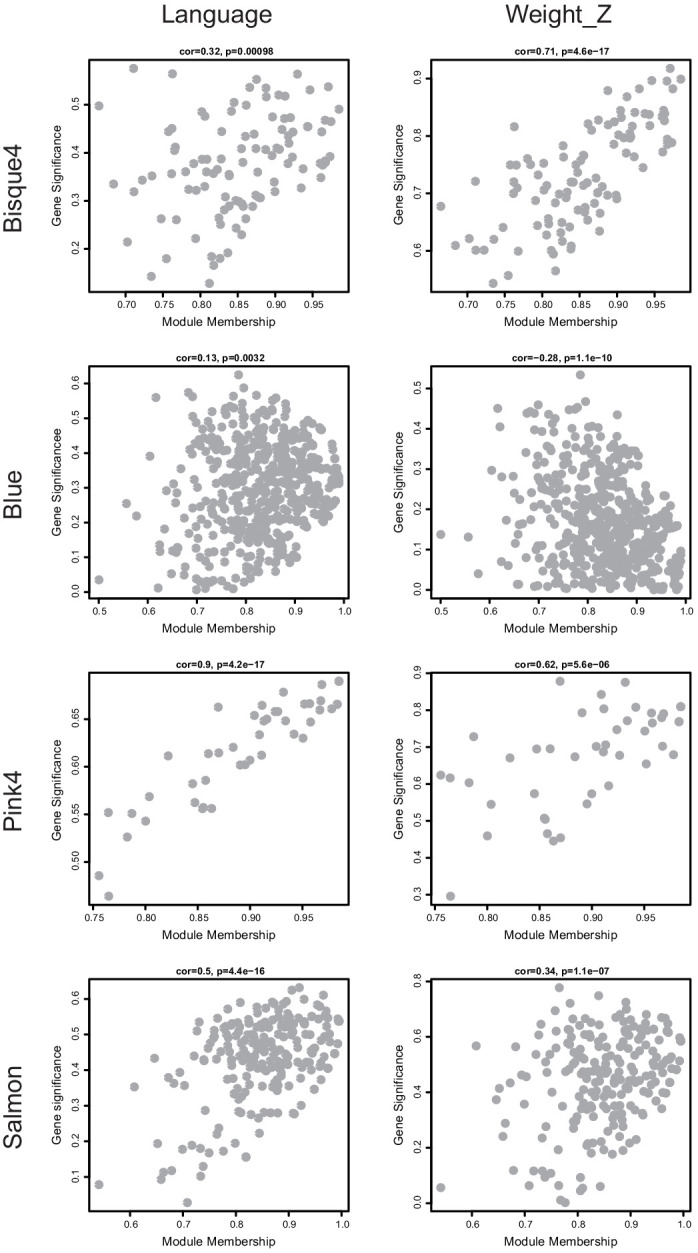
Figure 6—figure supplement 2. Individual sample outliers drive phenotype correlation in three significant modules.

Figure 6—figure supplement 3. Module correlation with donor clinical information.
