
Fig. 2. Epicenter connectivity versus estimated tau spreading sequences.
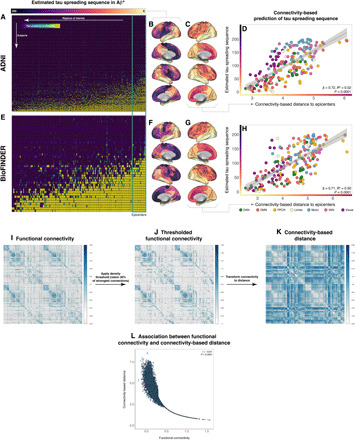
Tau positivity matrices for both Aβ+ subjects of the ADNI (A) and BioFINDER (E) were used to estimate tau spreading sequences for each sample. Blue colors indicate low tau positivity probabilities, while green-yellow colors indicate high tau positivity probabilities (B and F). Within each sample, tau epicenters were defined as those 10% of ROIs with earliest tau positivity [i.e., green box in (A) and (E); green outline in (B), (F), (C), and (G)]. Seed-based connectivity of the epicenters was determined on the basis of resting-state fMRI data from 1000 subjects of the human connectome project and transformed to connectivity-based distance (C and G). Scatterplots illustrate the association between connectivity-based distance to the epicenters and the tau positivity sequences for both ADNI (D) and BioFINDER (H). Using the 200 ROI brain parcellation shown in Fig. 1A, resting-state fMRI functional connectivity was assessed on 1000 subjects of the human connectome project. The resulting group-average connectivity matrix (I) was subsequently density thresholded to remove spurious connections (J) and transformed to connectivity-based distance (K), which is inversely related to functional connectivity (L).