
Fig. 2. Mouse CEBPA binding sites study.
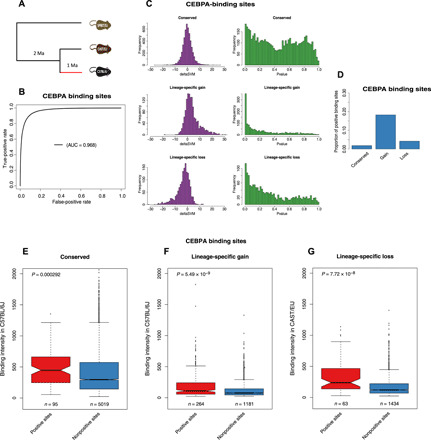
(A) Topological illustration of the phylogenetic relationships between the three mouse species used to detect positive selection on CEBPA binding sites. We want to detect positive selection that occurred on the lineage of C57BL/6J after divergence from CAST/EiJ, as indicated by the red branch. Ma, million years. (B) Receiver operating characteristic (ROC) curve for gkm-SVM classification performance on CEBPA binding sites (fivefold cross-validation). The AUC value represents the area under the ROC curve and provides an overall measure of predictive power. (C) The left-hand graphs are the distributions of deltaSVM. The right-hand graphs are the distributions of deltaSVM P values (test for positive selection). (D) Proportion of CEBPA binding sites with evidence of positive selection. (E to G) The number of binding sites in each category is indicated below each box. The P values from a Wilcoxon test comparing categories are reported above boxes. Positive sites are binding sites with evidence of positive selection (deltaSVM P value <0.01). (E) Conserved binding sites. (F) Lineage-specific gain binding sites. (G) Lineage-specific loss binding sites. We compare the binding intensity from CAST/EiJ, as an approximation for ancestral binding intensity, between positive loss binding sites and nonpositive loss binding sites.