
Fig. 3. Human CEBPA binding site study.
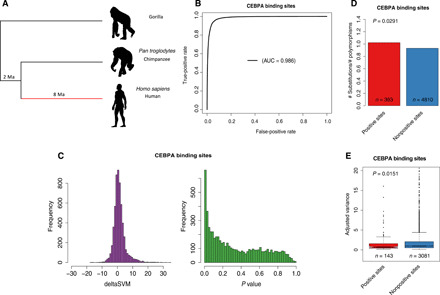
(A) Topological illustration of the phylogenetic relationships between human, chimpanzee, and gorilla. We detected positive selection that occurred on the lineage of human after divergence from chimpanzee, as indicated by the red branch. (B) ROC curve for gkm-SVM classification performance on CEBPA binding sites (fivefold cross-validation). The AUC value represents the area under the ROC curve and provides an overall measure of predictive power. (C) The left graph is the distribution of deltaSVM. The right graph is the distribution of deltaSVM P values (test for positive selection). (D) Ratio between the number of substitutions and the number of polymorphisms [single-nucleotide polymorphisms (SNPs)] for CEBPA binding sites. Positive sites are binding sites with evidence of positive selection (deltaSVM P value <0.01). The P value from Fisher’s exact test is reported above the bars. (E) Comparison of expression variance (adjusted variance) of putative target genes (closest gene to a TFBS) between positive sites and nonpositive sites. The number of binding sites in each category is indicated below each box. The P values from a Wilcoxon test comparing categories are reported above boxes. Positive sites are binding sites with evidence of positive selection (deltaSVM P value <0.01).