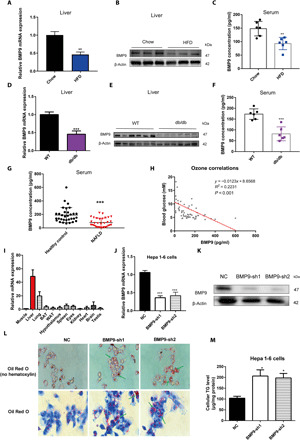
Fig. 1. BMP9 expression is decreased in multiple metabolic disorder models.

(A) Hepatic BMP9 mRNA, (B) BMP9 protein levels, and (C) serum BMP9 protein concentration were down-regulated in HFD mice. Eight-week-old C57BL/6 mice were fed an HFD for 8 weeks (n = 6). (D) Hepatic BMP9 mRNA, (E) BMP9 protein levels, and (F) serum BMP9 protein concentration were down-regulated in db/db mice. Eight-week-old db/db mice were fed a CD for 8 weeks (n = 6). (G) Serum BMP9 protein level in NAFLD patients. (H) Pearson’s R2 and P values for blood glucose levels versus BMP9 protein levels in human serum (n = 32). (I) Relative BMP9 mRNA expression level in multiple WT C57BL/6 mouse tissues (n = 6). (J) Knockdown of BMP9 mRNA in Hepa 1-6 cells by shRNA. NC, negative control. (K) BMP9 protein levels in BMP9-shRNA Hepa 1-6 cells. (L) Oil Red O staining showed cellular lipid accumulation in BMP9-shRNA Hepa 1-6 cells. (M) Cellular TG level. *P < 0.05, **P < 0.01, and ***P < 0.001.
